Remove solutions visualize-data
article thumbnail

Visualizing Air Quality with BreezoMeter's Pollution Heatmaps

Breezometer

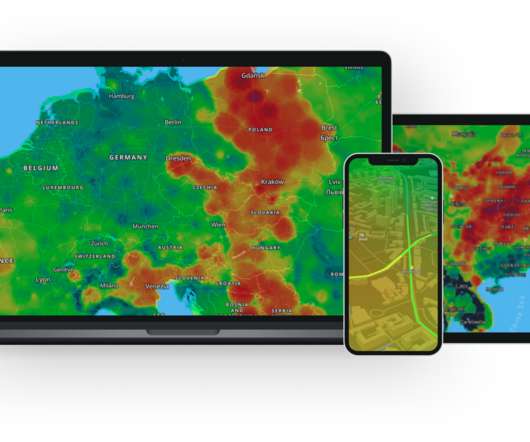
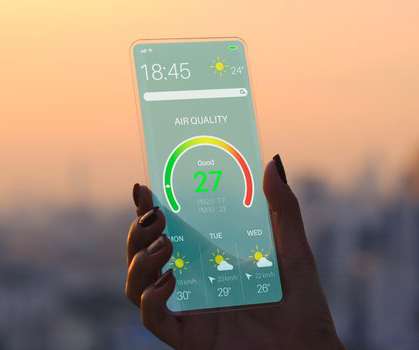
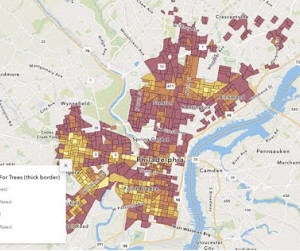
Our color-coded pollution heatmaps are one of BreezoMeter’s best-loved features and have always been a key part of what we do: Highly visual representations of air quality in a way that anyone can understand and act upon. In order for our air pollution heatmap visualization to support queries at an unmatched resolution of 5 meters (16.5

article thumbnail

What does physics look like, and does it matter?

Physics World

Looking up these terms and the related images on Google gives us a quick insight into the visual trends carrying an idea at a particular time and place. A powerful argument for the enduring visual power of the chalkboard is found in a work by Turner Prize nominated, multidisciplinary artist Goshka Macuga. Cosmic concepts.

2007 143
Insiders

Sign Up for our Newsletter

This site is protected by reCAPTCHA and the Google Privacy Policy and Terms of Service apply.

article thumbnail

Is Pollen Increasing Due To Climate Change? | BreezoMeter

Breezometer

After analyzing pollen data sets from a period of over two decades across the Northern Hemisphere, researchers concluded global warming is a key contributor to the trend of worsening North American pollen seasons. How Big Data & AI in Pollen Monitoring Bridges Reporting Gaps. Increasing Temperatures Affect Pollen Production.

article thumbnail

Bringing time?of?flight quality to non?TOF PET images

Physics World

The team developed three DL-TOF models (based on U-Net convolutional neural networks) to transform non-TOF PET data into corresponding TOF-like images. To train, validate and test the models, the team used PET data from 273 whole-body FDG-PET oncology exams performed at six clinical sites with TOF-capable PET/CT scanners.

Radiation 109
article thumbnail

Happy New Year from BreezoMeter’s CEO

Breezometer

BreezoMeter Now Delivers Air Quality Data to Yahoo Weather App Users Around the World - Here. Our Evolving Suite of Environmental Insights Solutions. We formally launched our much-needed wildfire tracker , enabling key businesses, governments & individuals to visualize the perimeters of moving wildfires in real-time.

2021 98
article thumbnail

Greenwashing in Graphs: an ExxonMobil Story

Union of Concerned Scientists

Earlier this year, ExxonMobil released its annual Advancing Climate Solutions report detailing the company’s current and planned contributions to a net-zero future. And as a scientist and data visualization enthusiast, I found the reports misleading at best, dishonest at worst, and nowhere is this more obvious than in the graphs.

article thumbnail

EHS Software Demo: Most Asked Questions

Capaccio

Are you considering various EHS software solutions but unsure just what to expect from a live demo? The demo gives you a chance to see and interact with the EHS-Dashboard to get a sense of how it can help you manage your EHS data, follow up with data contributors, generate reports, track chemicals, and a lot more.

52