
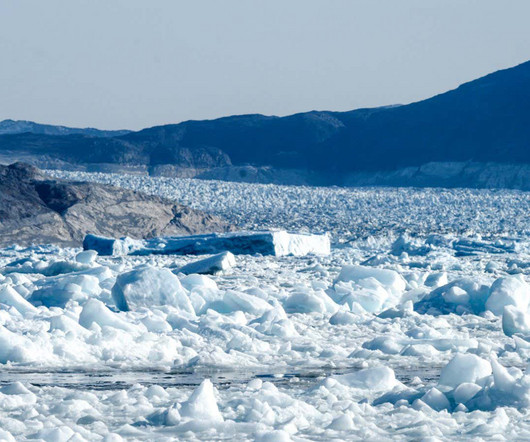
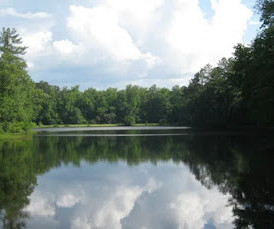
Hundreds of Greenland's glacial lakes have burst since 2008
New Scientist
JULY 22, 2024
Using satellite data, researchers identified hundreds of glacial lakes in Greenland that flooded their frozen shores over the past decade – helping speed up global sea level rise


Let's personalize your content