article thumbnail

Sea level in the IPCC 6th assessment report (AR6)

Real Climate

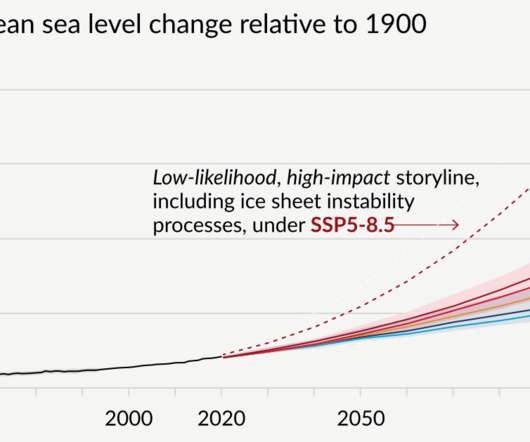
My top 3 impressions up-front: The sea level projections for the year 2100 have been adjusted upwards again. The IPCC gives more consideration to the large long-term sea-level rise beyond the year 2100. And here is the key sea-level graphic from the Summary for Policy Makers: Source: IPCC AR6, Figure SPM.8.

Sea Level 355
article thumbnail

Degradation of coastal regions in the Pacific Islands

Our Environment

Rising sea levels and increased intensity of storm surges are playing a considerable role in the degradation of coastal regions in the Pacific Islands. Illustrating the variation in sea levels from 1993 – 2018. Source: NASA (August 2018). Coastal change in the Pacific Islands.

Insiders

Sign Up for our Newsletter

This site is protected by reCAPTCHA and the Google Privacy Policy and Terms of Service apply.

article thumbnail

Deciphering the ‘SPM AR6 WG1’ code

Real Climate

The global mean sea level has increased by 20 cm from 1901 to 2018, and the rate of increase has accelerated and is now about 3.7 A thermal expansion explained 50% of sea level rise during 1971–2018, while ice loss from glaciers contributed 22%, ice sheets 20% and changes in land water storage 8%.

article thumbnail

Is there any Climate Justice or is it Just-us? A focus on the Caribbean

HumanNature

SIDS face a range of risks, including extreme floods, storms, droughts, unpredictability of precipitation patterns and sea-level rise, ocean acidification and deoxygenation (World Health Organization, 2018; Douglas & Cooper, 2020, Thomas, 2020). Baptiste, A., Martyr-Koller, R., Pringle, P., & Rhiney, K. Akiwumi, P.