CLIMATEWIRE | A new government forecasting system shows for the first time roads, streets and properties that are likely to be flooded by ongoing or upcoming rainstorms, providing unprecedented detail for preparations.
The National Weather Service venture offers the first real-time forecasting service that shows precise areas such as city blocks likely to experience at least an inch of flooding over the subsequent five days, shading the areas blue on an online map.
A leading NWS scientist called the forecasting system “a revolutionary advance” for providing detailed, street-level flood prediction in real time.
On supporting science journalism
If you're enjoying this article, consider supporting our award-winning journalism by subscribing. By purchasing a subscription you are helping to ensure the future of impactful stories about the discoveries and ideas shaping our world today.
“We're not just trying to say that the flood is at 10 feet. We're trying to say your street can be flooded,” said Mark Glaudemans, the chief of NWS’s Water Resources Services Branch. “With this five-day forecast, local authorities, emergency managers and the public can now make preparations to be ready.”
.png?w=1350)
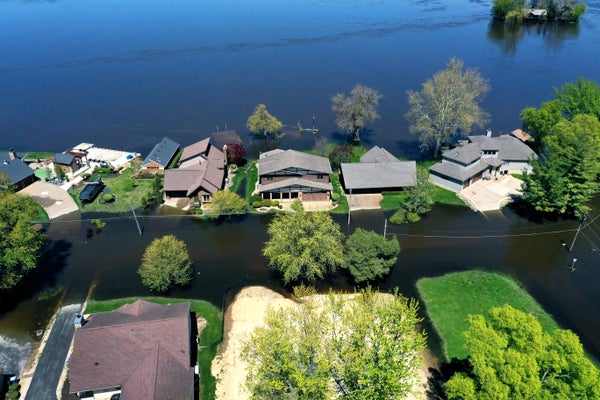
NWS’s new experimental flood inundation maps help communicate the timing and magnitude of high water events by showing modeled inundated areas in blue overlay. Emergency managers may use these services to preposition resources, secure critical infrastructure and recommend evacuations and evacuation routes. Credit: NOAA
The NWS system, dubbed a Flood Inundation Map, now covers about 10 percent of U.S. households, showing parts of eastern Texas, western Pennsylvania and upstate New York. By October 2025, the flood forecast will cover the entire nation — including Alaska and Hawaii — reporting five-day flood risk for all 3.4 million miles of rivers in the U.S., according to NWS.
Glaudemans said NWS’s existing advisories — flood surge maps and flood watches — are much more limited than the inundation maps launched in September. The advisories warn residents in a much wider region about surging water levels of nearby rivers rather than predicting exact locations facing high flood risks in the next hours and days.
The new forecasting system only projects inundations from riverine flooding and does not account for coastal flooding, storm surges or sewer overflows.
“Saying that there's going to be this many feet [of water] above the flood stage doesn't mean much” to most residents, said John Nielsen-Gammon, the state climatologist of Texas. Communicating flood risk “in a graphic way that people understand will be a tremendous advance.”
The new flood forecast shows how flooding will affect small areas “by putting water on the map,” Glaudemans said. Local authorities and disaster responders will recognize the precise areas that demand attention when heavy rain pushes up water levels to dangerous heights, helping them prepare for floods more quickly and efficiently, he added.
The new online forecast also differs from the flood maps created by the Federal Emergency Management Agency that show areas with the highest flood risk, Glaudemans said.
Climate scientists say global warming will fuel more intense and frequent storms that inundate neighborhoods and key infrastructure such as roads, bridges and power grids. With rising sea temperatures, hurricanes also are increasing in strength and are more likely to reach inland areas and dump inches of rain in a matter of hours.
The flood forecast combines ground elevation data with models predicting river-level rises to mark areas on interactive maps that could submerge after rain, Glaudemans said. Lower lands start flooding first when rivers overflow. A contour map that shows elevation every 30 feet lets NWS make street-by-street flood projection for certain levels of rainfall.
But the new flood forecast also has weaknesses and limitations.
The national flood forecast relies on estimates rather than observed data for local factors, affecting its accuracy, Glaudemans said. Data showing factors such as riverbed shapes and the amount of rain absorbed by soil and plants is not available for “99% of the country,” Glaudemans wrote in an email.
“This information is expensive to collect and is simply not possible to obtain for the 3.4 million miles of rivers covered by” the new flood forecast, Glaudemans added.
The new forecast does not display projected flood depth and ignores the chances of levees failing, says an NWS webpage answering frequently asked questions.
If a house or a street is shaded blue on the flood map, “it does not necessarily mean you are or will experience flooding,” the webpage says. But it does mean “that heightened attention and awareness is needed.”
“We know from weather forecasting that models can be wrong,” said Nielsen-Gammon, the Texas climatologist. “We’ll need to really see how they perform over a period of time to get a better sense of their accuracy.”
Reprinted from E&E News with permission from POLITICO, LLC. Copyright 2023. E&E News provides essential news for energy and environment professionals.