
Mammoth Tusk Reveals Ancient Mammal’s Travels

Chemical analyses showed an individual mammoth made an epic journey across Alaska

Mammoth.

Beth Zaiken


On supporting science journalism

If you're enjoying this article, consider supporting our award-winning journalism by subscribing. By purchasing a subscription you are helping to ensure the future of impactful stories about the discoveries and ideas shaping our world today.


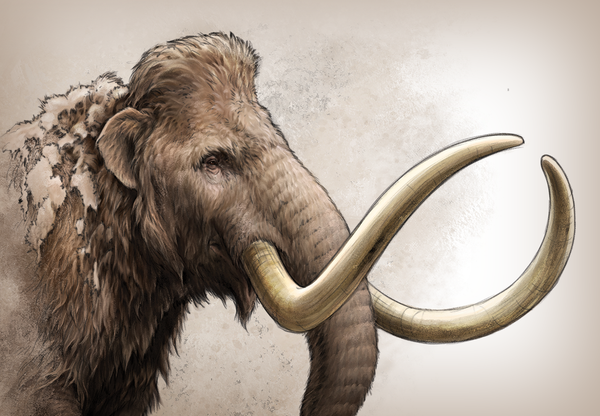
Mammoths are among the best-known inhabitants of the last ice age. Fossils usually offer a static snapshot of an animal's life, but researchers recently used one to track every place a male mammoth traveled from birth to death. By analyzing the chemicals in a 17,100-year-old tusk, scientists found the mammoth walked far enough to loop around the world twice—likely in search of food and a mate.

“Tusks are like time lines,” adding layers each year that contain chemicals from the environment, says Matthew J. Wooller, a paleoecologist at the University of Alaska Fairbanks. He and his colleagues sliced a five-and-a-half-foot-long tusk in half, then measured chemical ratios in each layer to re-create the mammoth's itinerary. Over 28 years the animal walked nearly 80,000 kilometers across what is now Alaska. The team plans to apply the same technique to more tusk fossils in the future. “We have hundreds,” Wooller says.

None

Credit: Beth Zaiken (illustrations) and Jen Christiansen (maps); Source: “Lifetime Mobility of an Arctic Woolly Mammoth,” by Matthew J. Wooller et al., in Science, Vol. 373; August 2021 (map reference)

Tess Joosse was formerly an Editorial Fellow at Scientific American. She earned a master's degree in science communication from the University of California, Santa Cruz.

More by Tess Joosse

Beth Zaiken is an award-winning Minnesota-based professional artist and illustrator specializing in natural science communication. See more of her work at www.bethzaiken.com.

More by Beth Zaiken

Jen Christiansen is author of the book Building Science Graphics: An Illustrated Guide to Communicating Science through Diagrams and Visualizations (CRC Press) and senior graphics editor at Scientific American, where she art directs and produces illustrated explanatory diagrams and data visualizations. In 1996 she began her publishing career in New York City at Scientific American. Subsequently she moved to Washington, D.C., to join the staff of National Geographic (first as an assistant art director–researcher hybrid and then as a designer), spent four years as a freelance science communicator and returned to Scientific American in 2007. Christiansen presents and writes on topics ranging from reconciling her love for art and science to her quest to learn more about the pulsar chart on the cover of Joy Division's album Unknown Pleasures. She holds a graduate certificate in science communication from the University of California, Santa Cruz, and a B.A. in geology and studio art from Smith College. Follow Christiansen on X (formerly Twitter) @ChristiansenJen

More by Jen Christiansen
Scientific American Magazine Vol 325 Issue 6This article was originally published with the title “Mammoth Travels” in Scientific American Magazine Vol. 325 No. 6 (), p. 76
doi:10.1038/scientificamerican1221-76