Many aspects of our world, from the body mass of creatures in the animal kingdom to the population of cities across the globe, follow an intriguing mathematical pattern. Known as Zipf's law, the rule says that when something's size is doubled, that thing becomes about half as common. Researchers wondered whether the law extended to the human body. Ecologist Ian A. Hatton of McGill University, independent researcher Jeffery A. Shander and their colleagues amassed data about the volume and frequency of human cells and looked for the pattern. It turns out that it holds.
“As you double the volume of a cell, the frequency of cells of that size is halved,” Hatton says. Teensy, nonnucleated red blood cells are by far the most common cells in our bodies, whereas the comparatively gigantic muscle cells in our arms and legs are the scarcest. Being able to use a cell's size to estimate its frequency in the body could help doctors better understand certain body systems and hard-to-count cell types, the researchers say. The study suggests, for instance, that immune cells called lymphocytes are far more common than biologists realized.

Credit: Ni-ka Ford (illustrations) and Jen Christiansen (chart); “The Human Cell Count and Size Distribution,” by Ian A. Hatton et al., in PNAS, Vol. 120; September 2023 (data)
On supporting science journalism
If you're enjoying this article, consider supporting our award-winning journalism by subscribing. By purchasing a subscription you are helping to ensure the future of impactful stories about the discoveries and ideas shaping our world today.
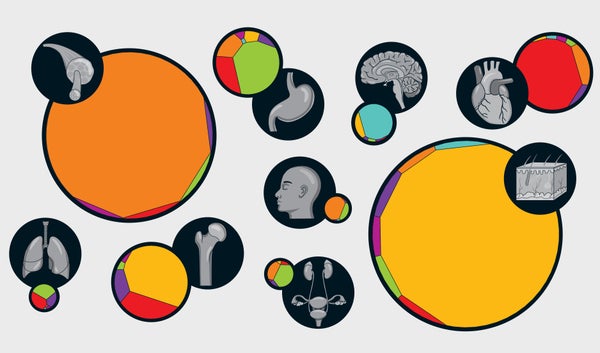
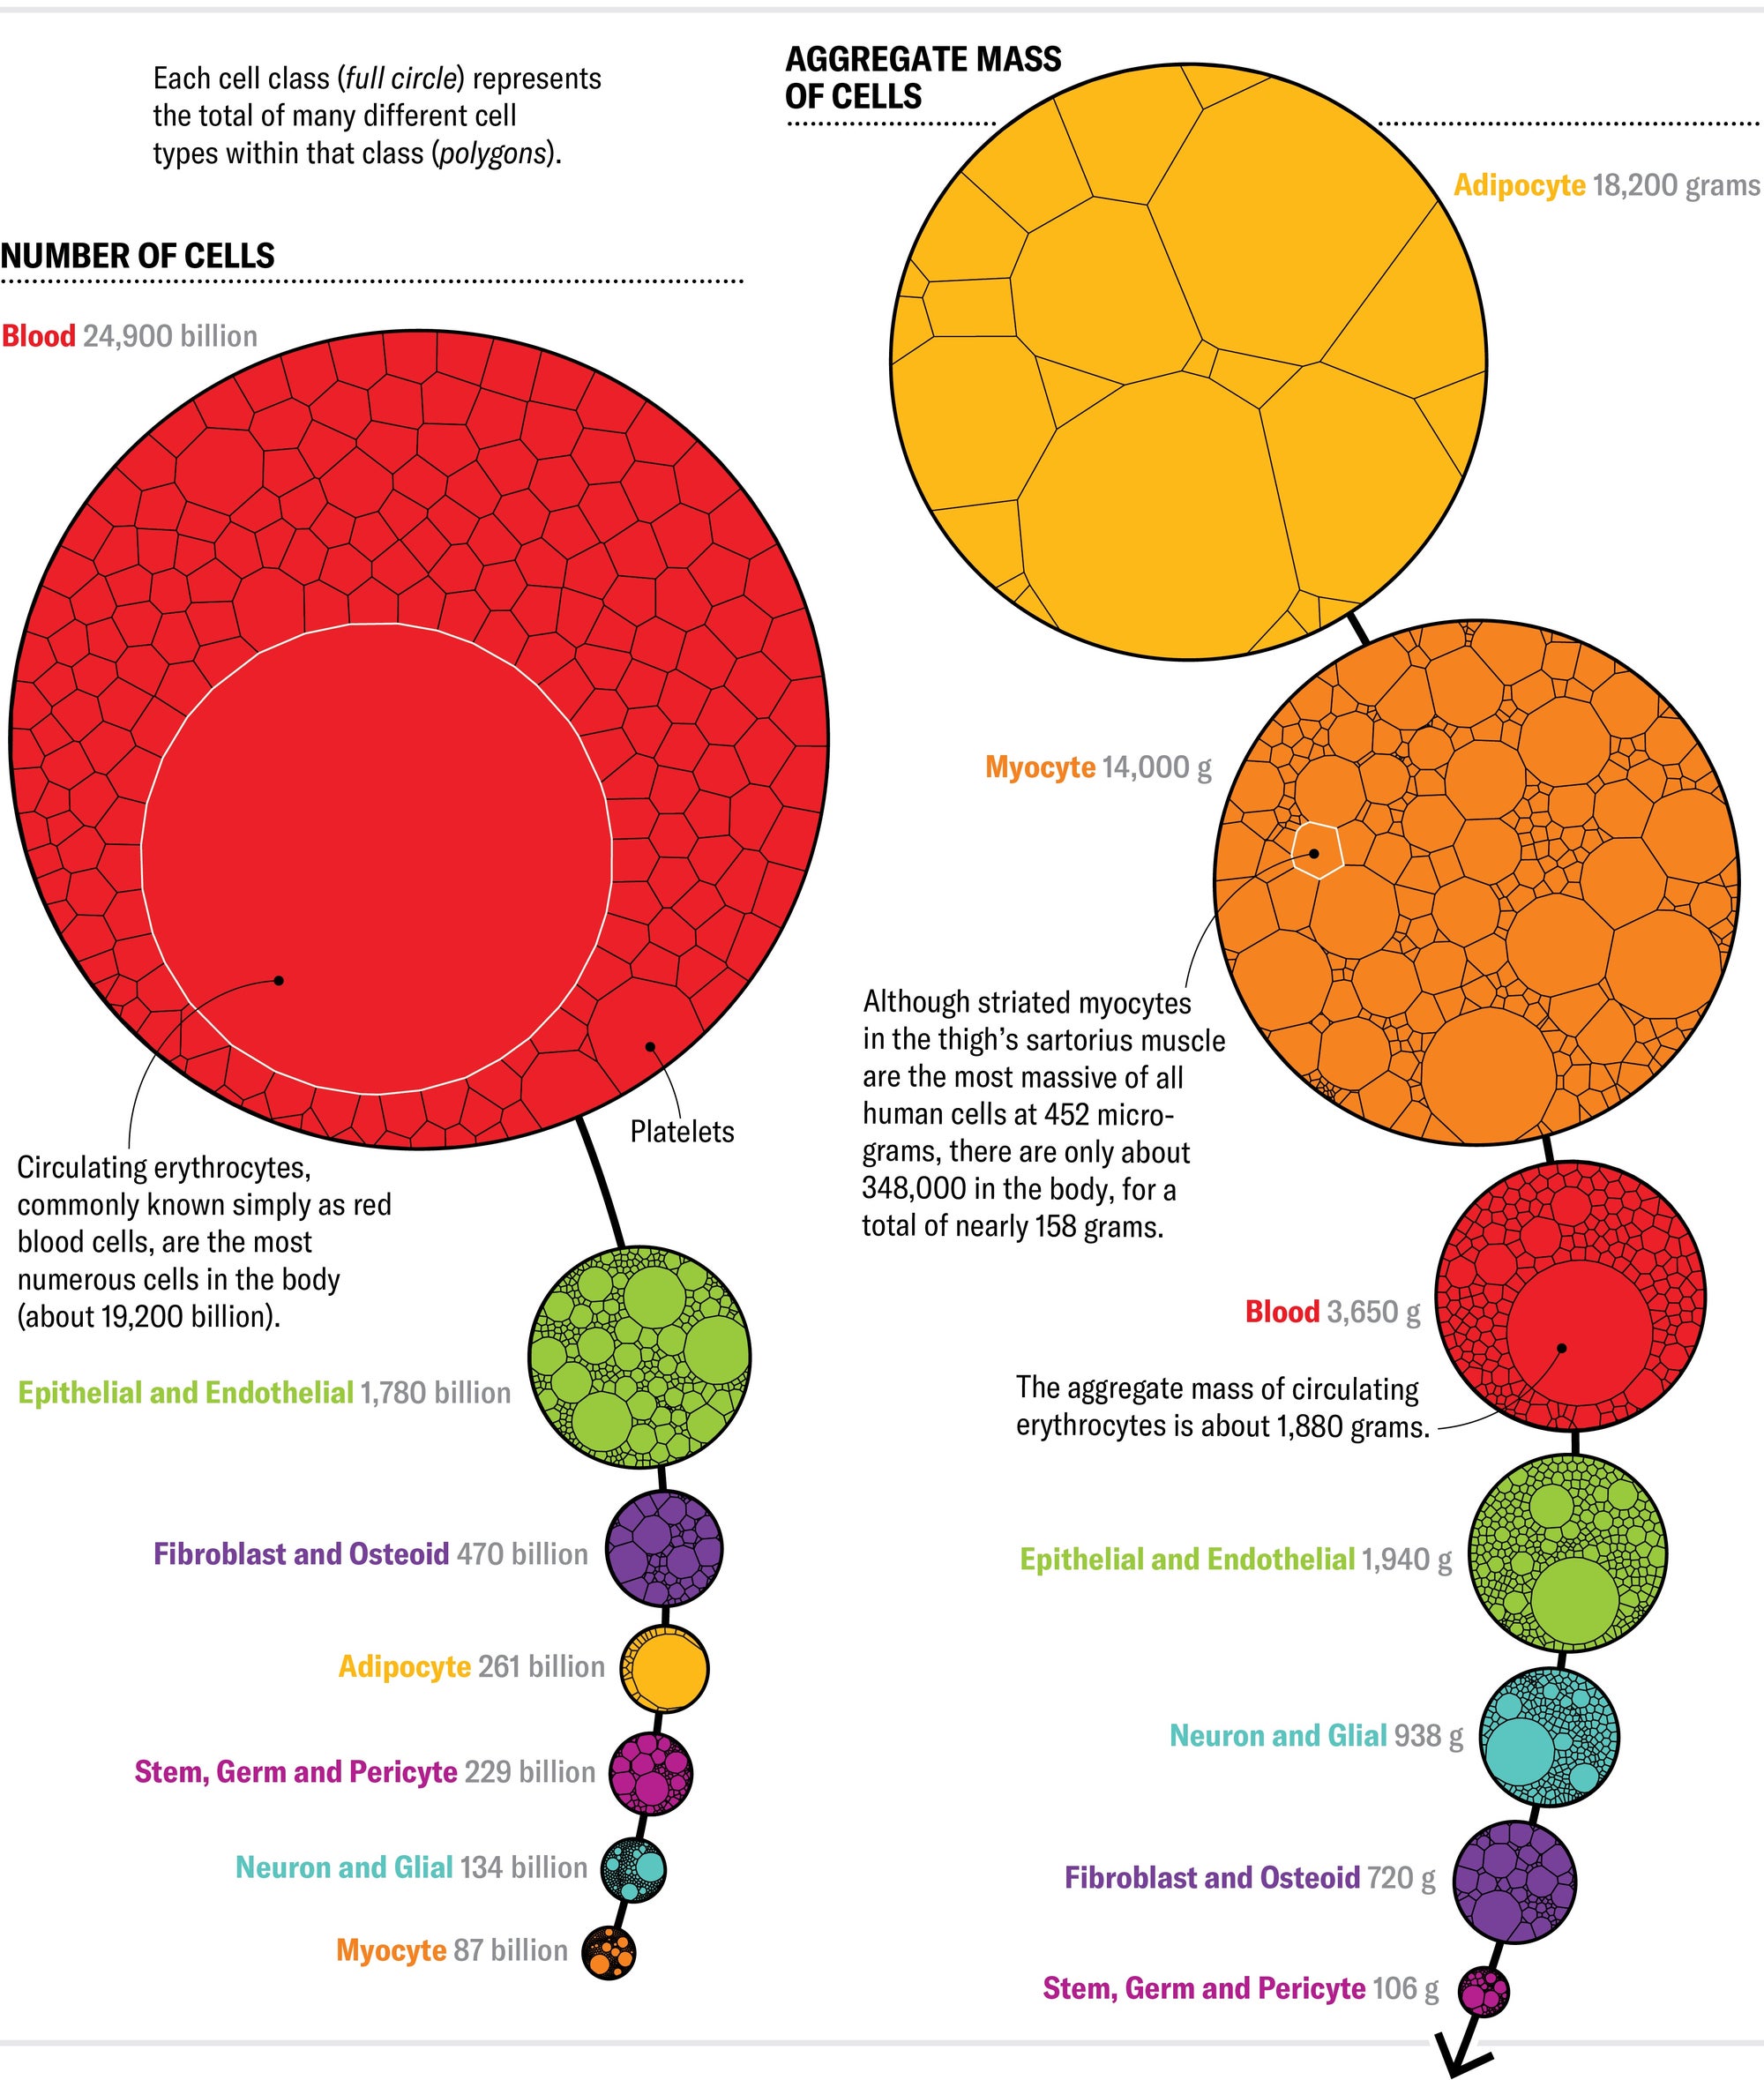
NUMBER AND AGGREGATE MASS OF CELLS IN THE HUMAN BODY, BY CELL CLASS
(Calculated for a 60-kilogram female form.) These two strands show the hierarchy of cells by number (frequency in the body) as well as by how much total biomass they account for in the body. The discrepancy between the two arises from the fact that the most numerous cells are often very small and therefore contribute only a modest amount of biomass, whereas the more massive cells, though relatively uncommon, make up much of our heft. Total cell mass does not equal total body mass, because bodies also include large volumes of water.
Credit: Jen Christiansen; “The Human Cell Count and Size Distribution,” by Ian A. Hatton et al., in PNAS, Vol. 120; September 2023 (data)
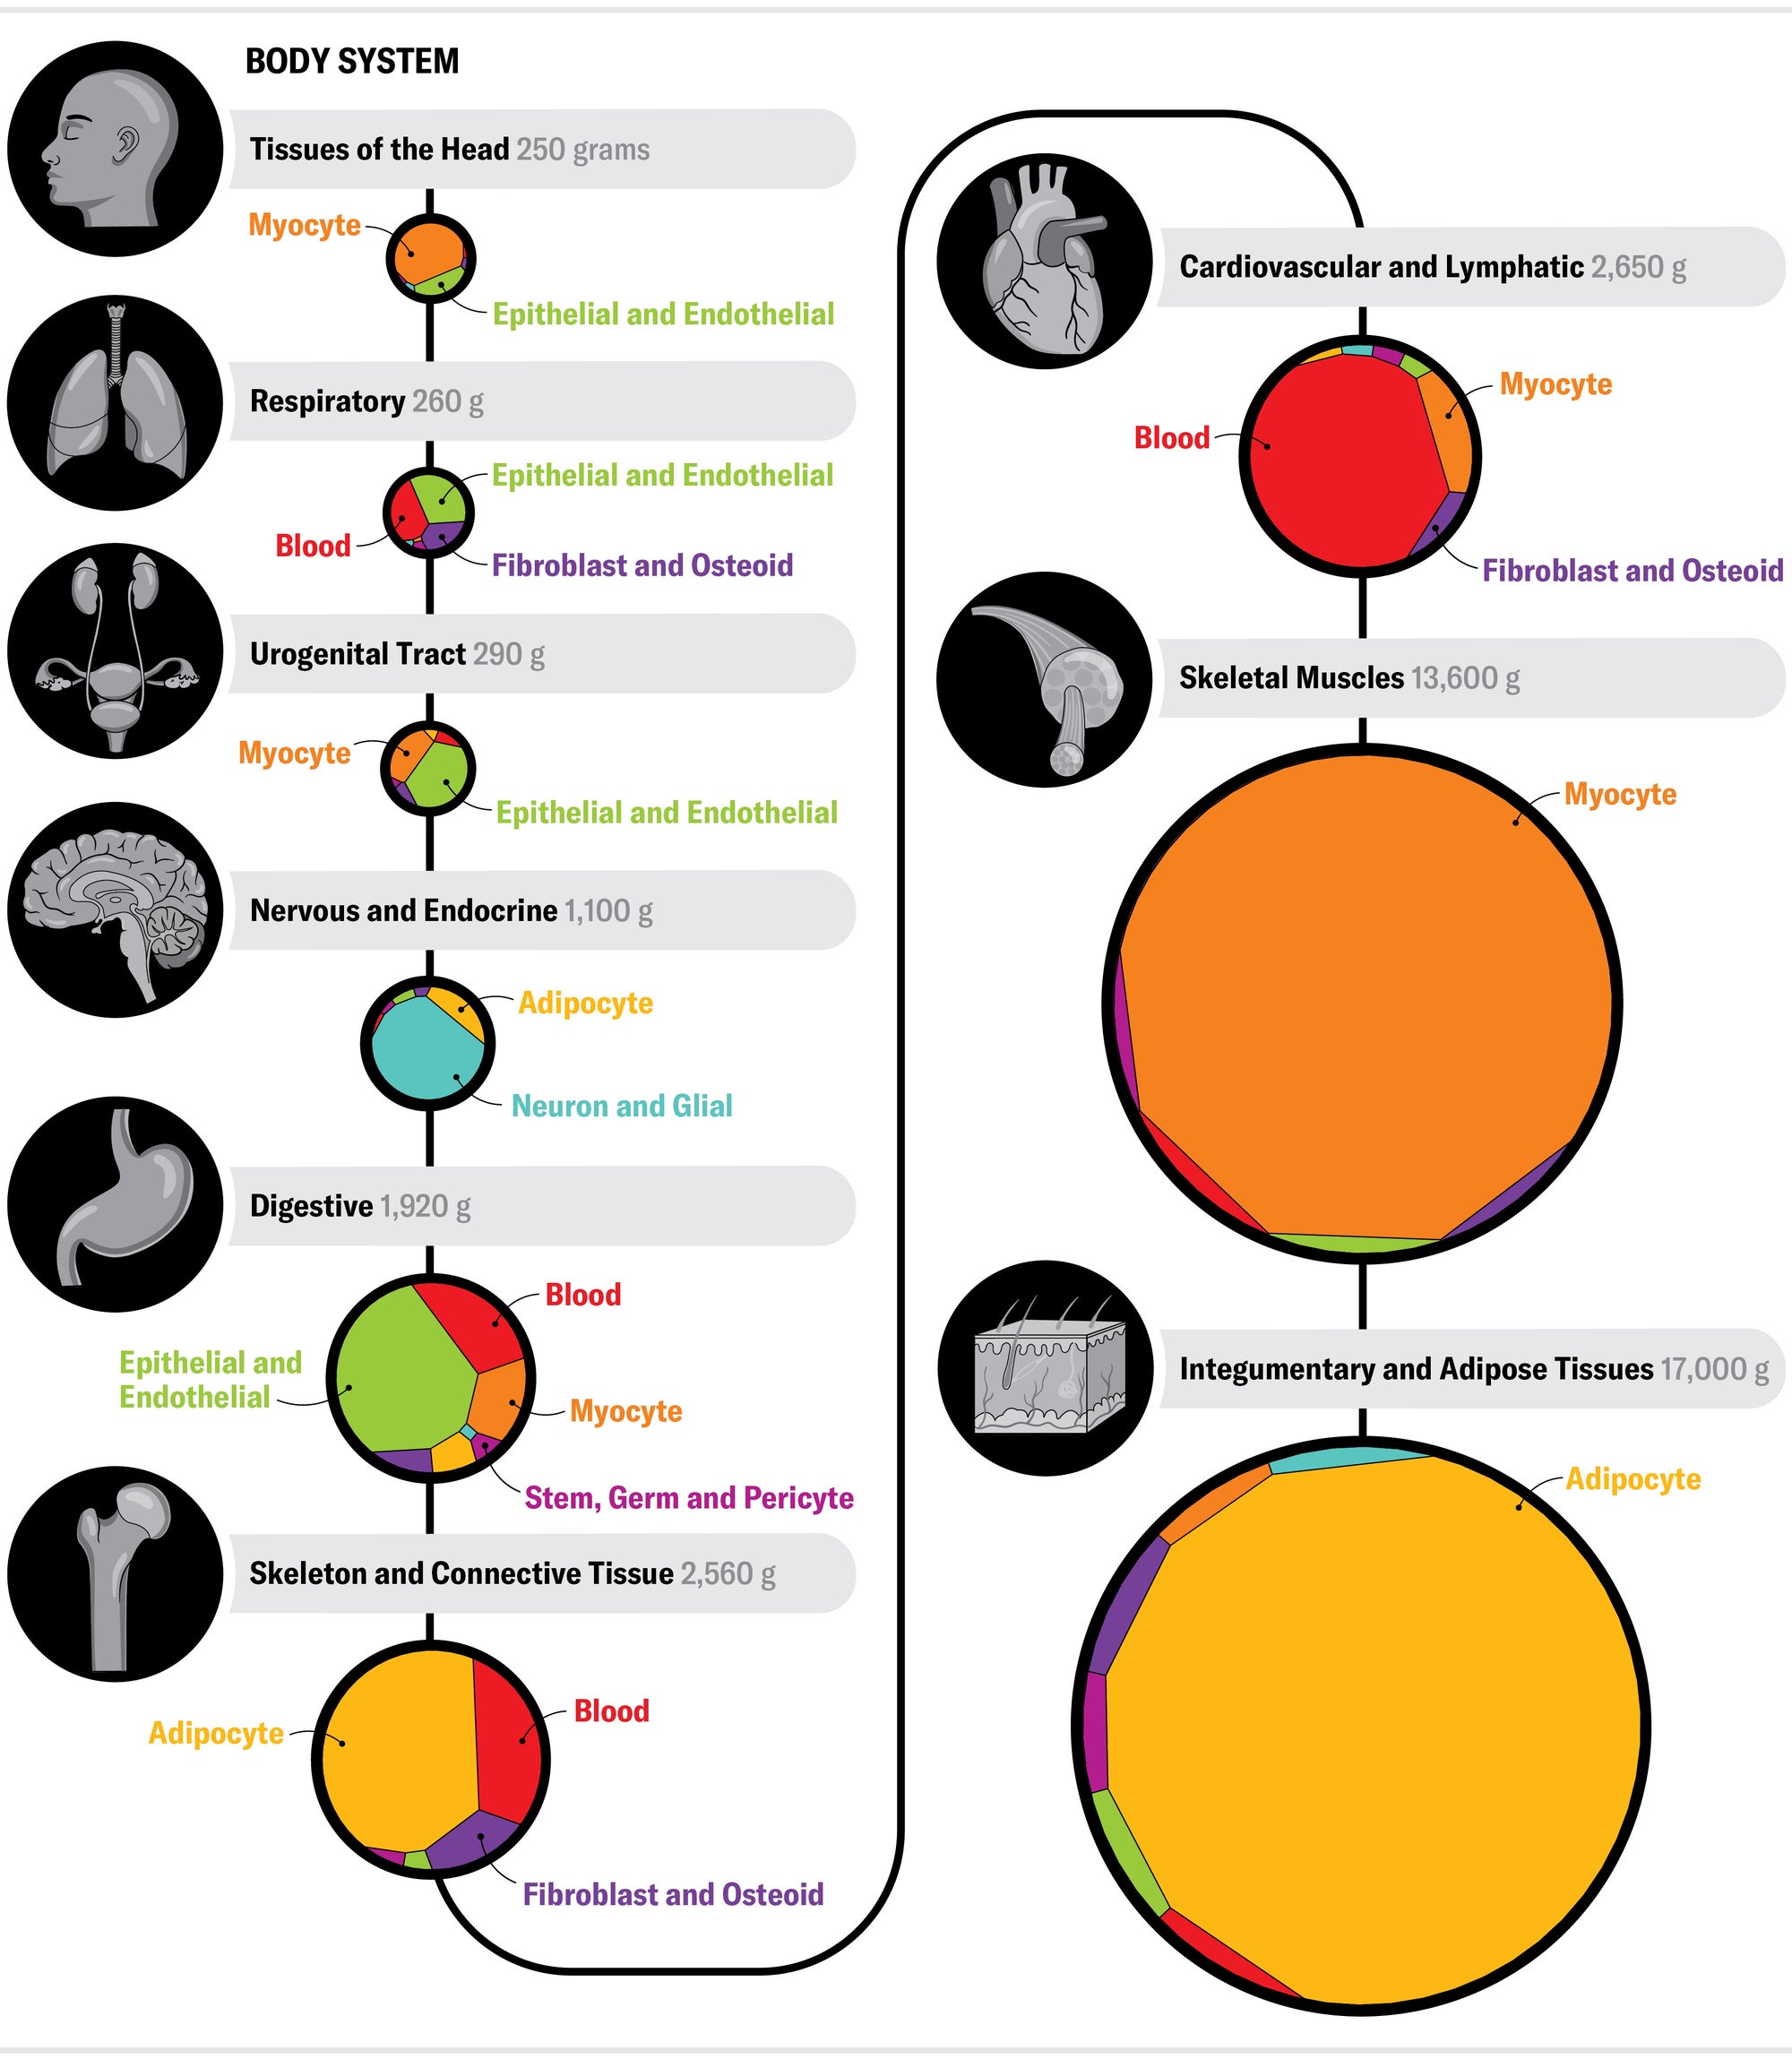
MASS OF BODY SYSTEMS
(Calculated for a 60-kilogram female form.) Different systems in the human body account for differing amounts of our total biomass. The largest system, the integumentary and adipose tissues, consists mainly of skin and fat.
Credit: Ni-ka Ford (illustrations) and Jen Christiansen (chart); “The Human Cell Count and Size Distribution,” by Ian A. Hatton et al., in PNAS, Vol. 120; September 2023 (data)