
Updated with latest NOAA 2023 figures for weather and climate disasters as of 9/11/2023.
The 2023 Danger Season has been unleashed like never before.
In June and July, heat waves that brought temperatures over 113°F baked the Southwest and the Southeast. By the end of July, Phoenix, AZ, had experienced 31 days in a row with at least 110°F. During most of June, an unprecedented heat wave in Puerto Rico brought heat index temperatures up to 125°F.
In early August, devastating fires in Maui spread quickly due to dry conditions and winds from a distant hurricane. Nearly 40,000 wildfires across the United States burned almost 2 million acres by the end of August.
Hilary was the first tropical storm to hit California in 84 years and prompted flooding alerts in Arizona, Colorado, Idaho, Oregon, and Washington state as well.
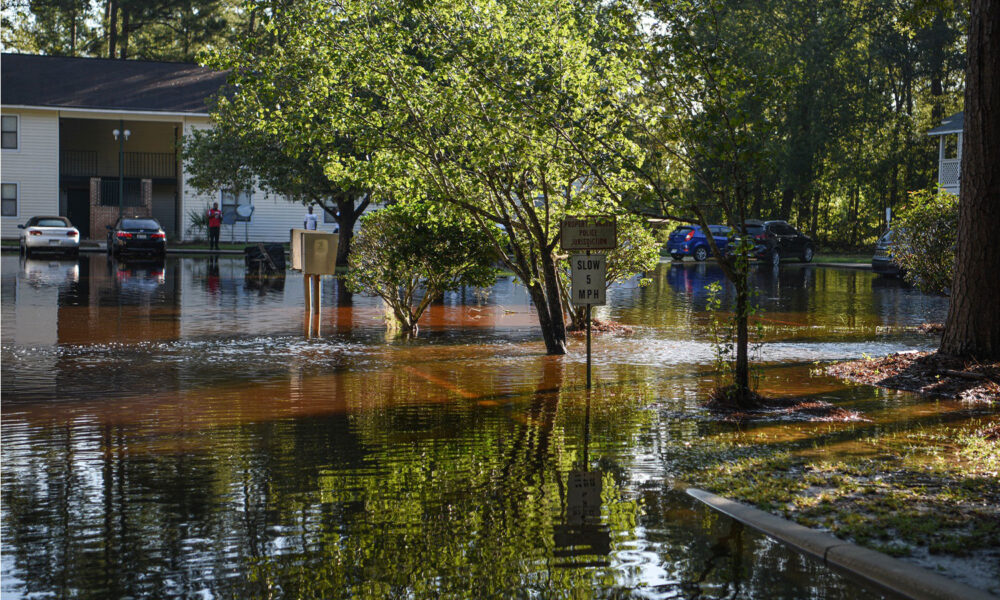
In late August, Florida faced, simultaneously, storm and flood threats from Hurricane Idalia on its west coast, and extreme heat alerts along most of the state’s Atlantic coastline. And catastrophic flash and river flooding across much of Vermont occurred in early July.
Taken together, extreme heat, floods, wildfires, and storms have impacted most of the population throughout the United States and its territories since Danger Season started on May 1. In fact, as of September 6, 96% of people in the US have faced at least one of these alerts.
But these impacts are inequitably distributed across the social and physical geography of Danger Season. People living with low incomes—many of whom are people of color—are more hard-pressed to stay safe from the impacts of adverse weather events than others. This and other population characteristics shape how populations are able to respond to, and remain safe from, extreme weather events during Danger Season.
To understand how Danger Season can impact different populations, I combined the total number of heat, flooding, fire weather, and flood alerts issued by the National Weather Service (NWS) since May 1 with the Centers for Disease Control and Prevention’s Social Vulnerability Index (CDC SVI).
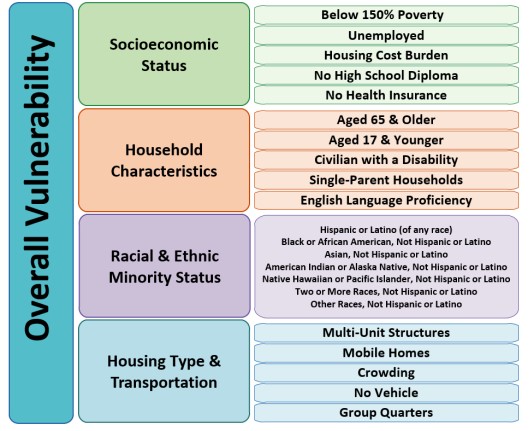
The SVI ranks counties on 16 social factors, including unemployment, race and ethnicity, and disability, and further groups them into four related themes (see the CDC SVI graphic below). Each county receives a ranking for each Census variable and for each of the four themes as well as an overall ranking.
I also obtained, from the daily tally of NWS alerts that powers the UCS Danger Season website, the total number of heat, flood, fire weather, and storm alerts issued for each county between May 1, 2023 and September 11, 2023.
I then categorized, for each county, both the ranking of the SVI overall vulnerability and the total number of alerts as low, medium, or high. I did this to get a better understanding of how populations with different resources and social, economic, and physiological characteristics can withstand Danger Season threats. Below I break this down for each alert type.
Danger Season and extreme heat
Extreme heat this year has been brutal and record-breaking—all across North America, the Caribbean, Europe, and China.
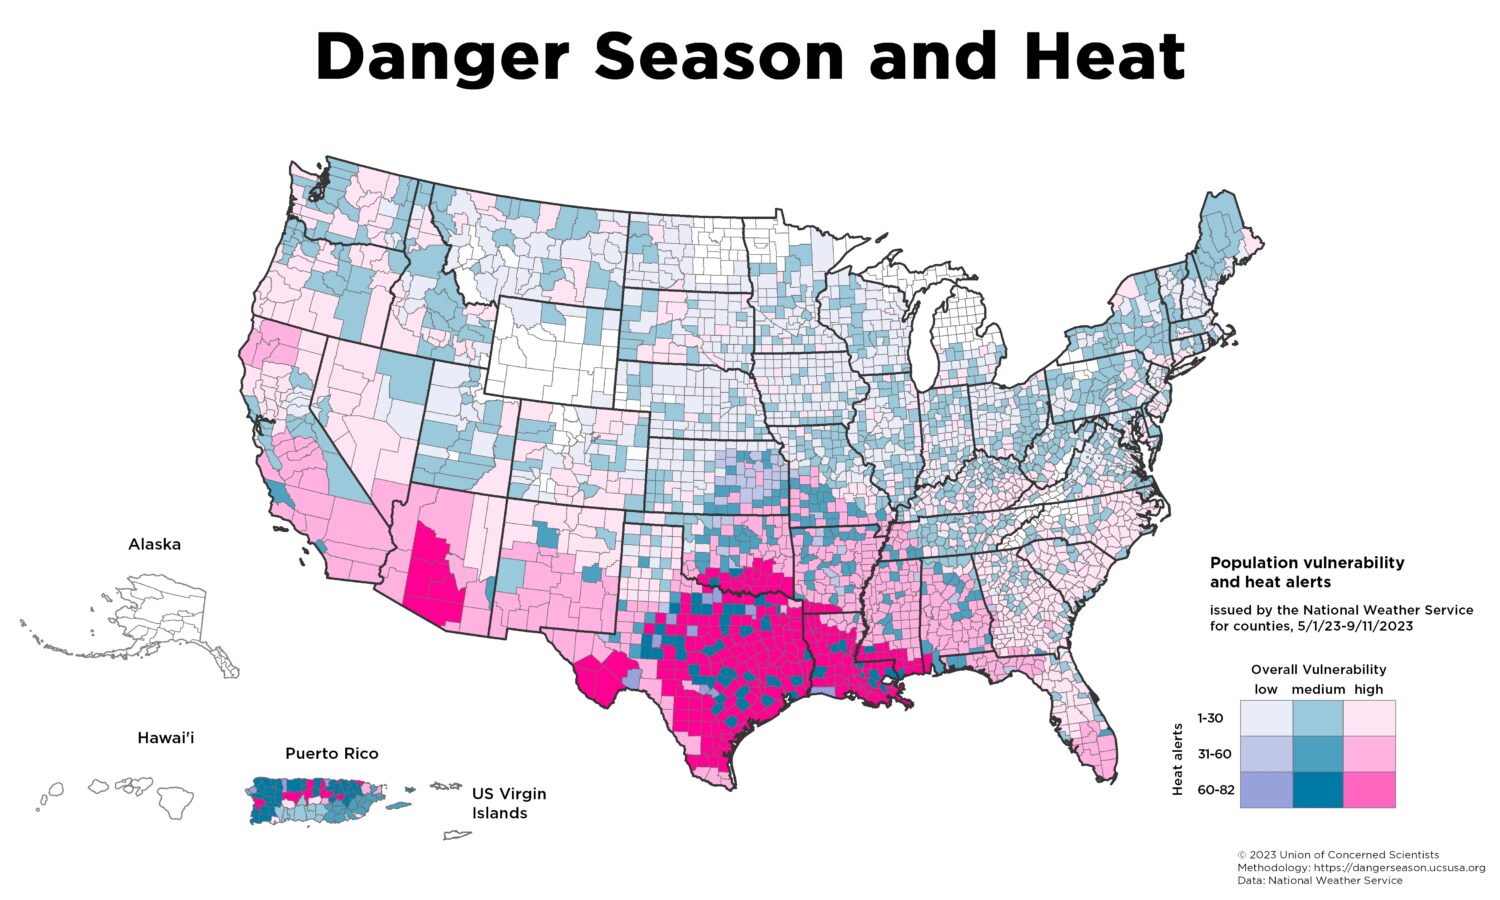
In the US, the largest number of heat alerts were issued for counties in the Southwest (south Texas in particular) and in the county-equivalent municipios in Puerto Rico (there have been no heat alerts for Hawai’i or Alaska).
Population vulnerability in these places scores high in the four themes of socio-economic, household characteristics, people of color, and housing and transportation in the SVI. This means that the population in the pink hues faced between 31-90 heat alerts and are mostly people of color, lacking health insurance and formal educational levels, living with low incomes, in multi-family structures and with little ability to speak English.
These factors are all associated with worse health outcomes from exposure to extreme heat. This risk assessment is not hypothetical—as of August, Maricopa County, Arizona (where Phoenix is the largest population center) had 180 confirmed heat-associated deaths, and many more in counties in that state as well as in Texas and Nevada, which are thought to be an undercount of actual heat-related deaths.
And academic performance in lower-income school districts, as well as among Black and Hispanic students in the US, is lower on hot school days. Note that while municipios in blue tones in Puerto Rico may appear to be less vulnerable than those in pink hues in the contiguous US, these are not directly comparable because the CDC generated SVI rankings separately for Puerto Rico. Also, there were no available social vulnerability data for the US Virgin Islands, so they are not included in the analysis.
Danger Season and floods
Flooding has been widespread this Danger Season. Up to 12 inches of precipitation fell in Kentucky and Illinois, and up to eight inches in the Northeast. 70,000 people attending the Burning Man festival were stuck in mud for a few days in the northern Nevada desert after a storm dropped about half an inch in what is usually the driest state in the country. In much of the Northeast, up to three times the annual precipitation many of these places usually get rained down during the first two weeks of July.
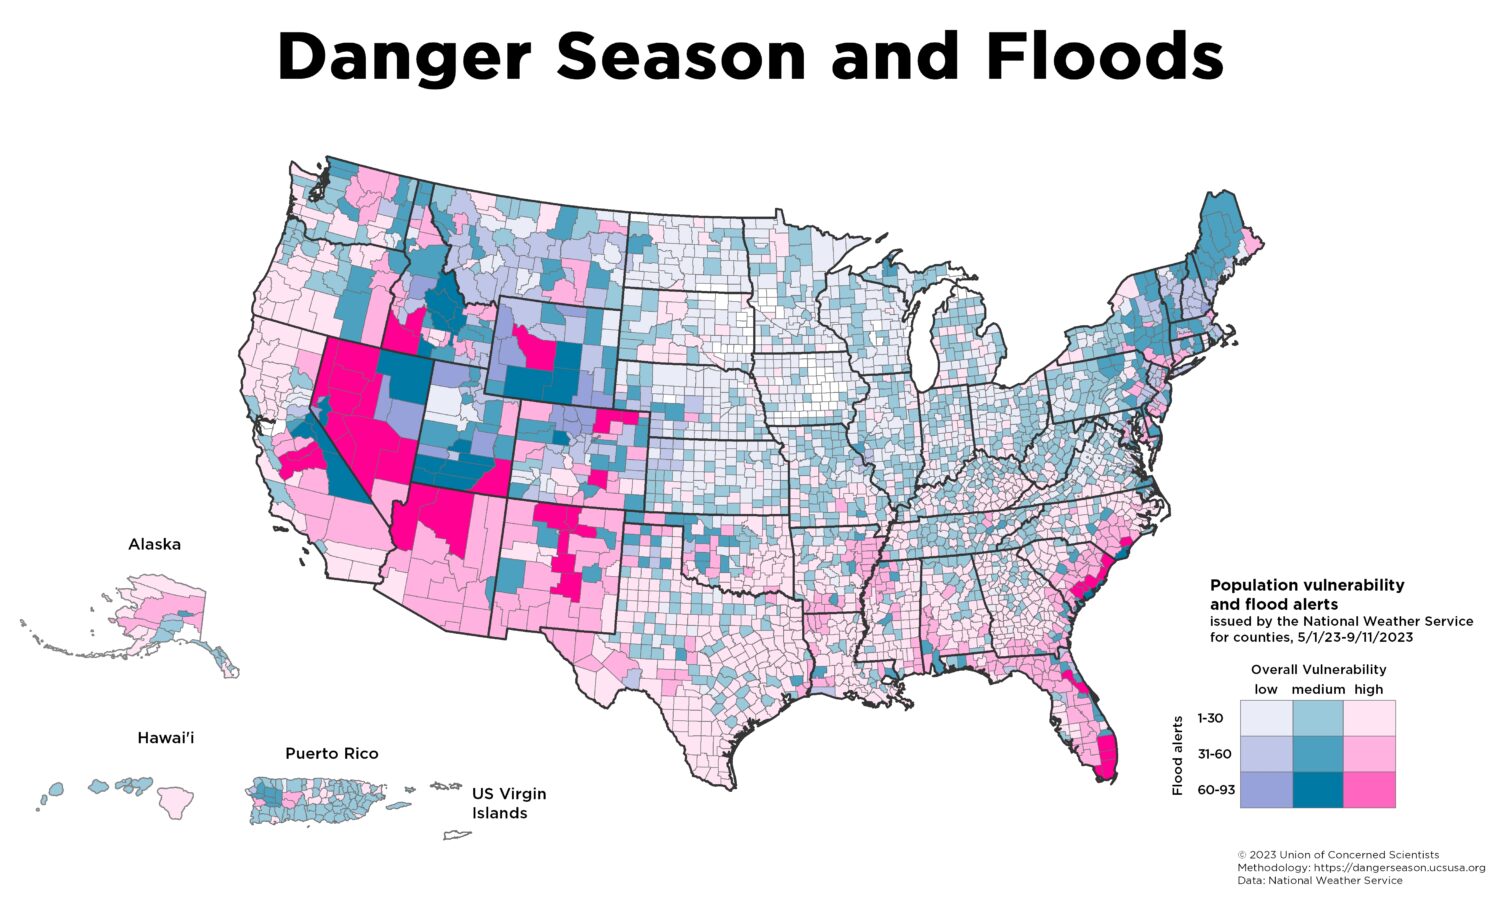
The largest number of flooding alerts were issued in Arizona, California, Colorado, Idaho, Nevada, New Mexico, Wyoming and coastal areas of Florida, South Carolina, North Carolina and the New England states.
Many counties with at least 30 flood alerts in these regions have medium or high levels of population vulnerability. In addition, many counties in the Northeast that flooded during the Great Vermont Flood of 2023 have medium and high levels of vulnerability.
In particular, many Northeast counties have high rates of households without an available vehicle (thus making it difficult to escape) or living in mobile homes, which have higher flood risks than other housing types because they tend to be located in floodplains. Flooding from tropical storms and hurricanes threaten coastal communities such as the United Houma Nation in Louisiana.
Many of these communities have been hit by back to back disasters, and also face coastal erosion, COVID-19 impacts, and climate-augmented storms like Hurricane Ida. And some among those who can afford and have flood insurance policies are facing rising prices and even losing their policies because climate change has made it more risky for insurance companies to provide protection.
Danger Season and fire weather
In addition to burning nearly 2 million acres of land across the US, wildfires in the US and Canada choked the skies this Danger Season, bringing some of the world’s worst air quality to the Midwest and Northeast.
Fire weather alerts are issued by the NWS when a combination of sustained high winds (at least 15 miles per hour on average), low relative humidity, and temperatures 75°F or greater occurs, or when there are ongoing wildfires and these conditions are also present.
Fire weather alerts were concentrated in the Pacific Northwest and the Southwest. In particular, counties in Alaska, Arizona, Colorado, New Mexico, Utah, Oregon, and Washington experienced between 21-51 such alerts.
Counties in Hawai’i had a small number of such alerts, contributing to the terrible death and destruction of the Maui wildfires earlier in August.

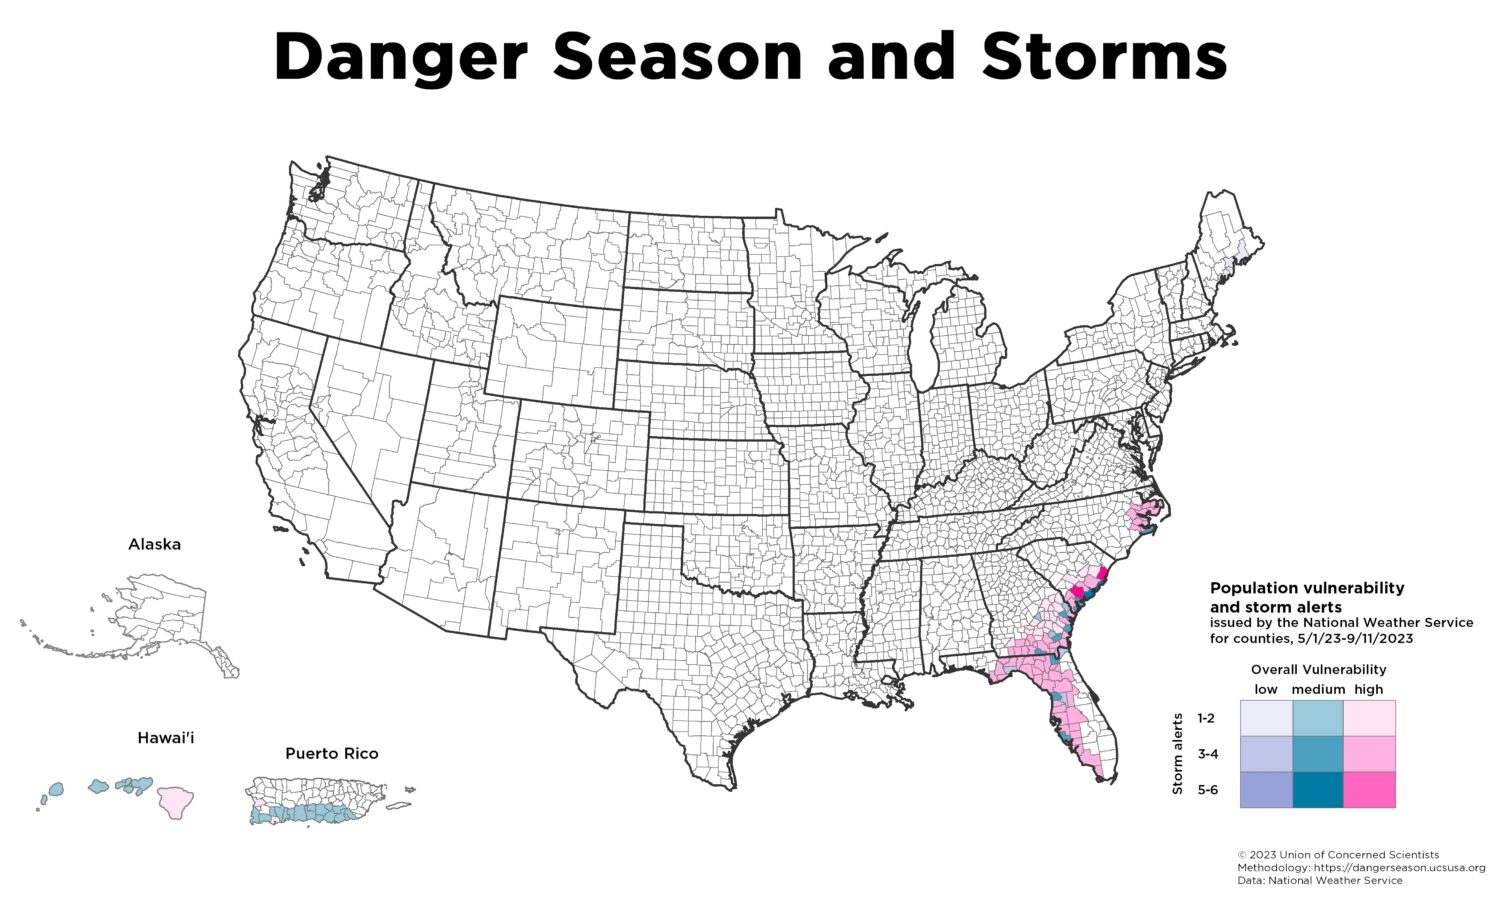
Danger Season and storms
Storm alerts this year have been much less numerous than other types of Danger Season alerts. Only a handful of these were issued along coastal areas of Florida, Georgia, Hawai’i, Puerto Rico, North Carolina and South Carolina.
Storms also bring inland flooding and storm surge potential, so these threats from storms are usually captured in flood alerts (for example, the local NWS offices in Los Angeles and San Diego issued flood alerts instead of storm alerts in anticipation of Tropical Storm Hilary).
Still, counties in Southeast states that were under storm alerts also have high levels of population vulnerability.
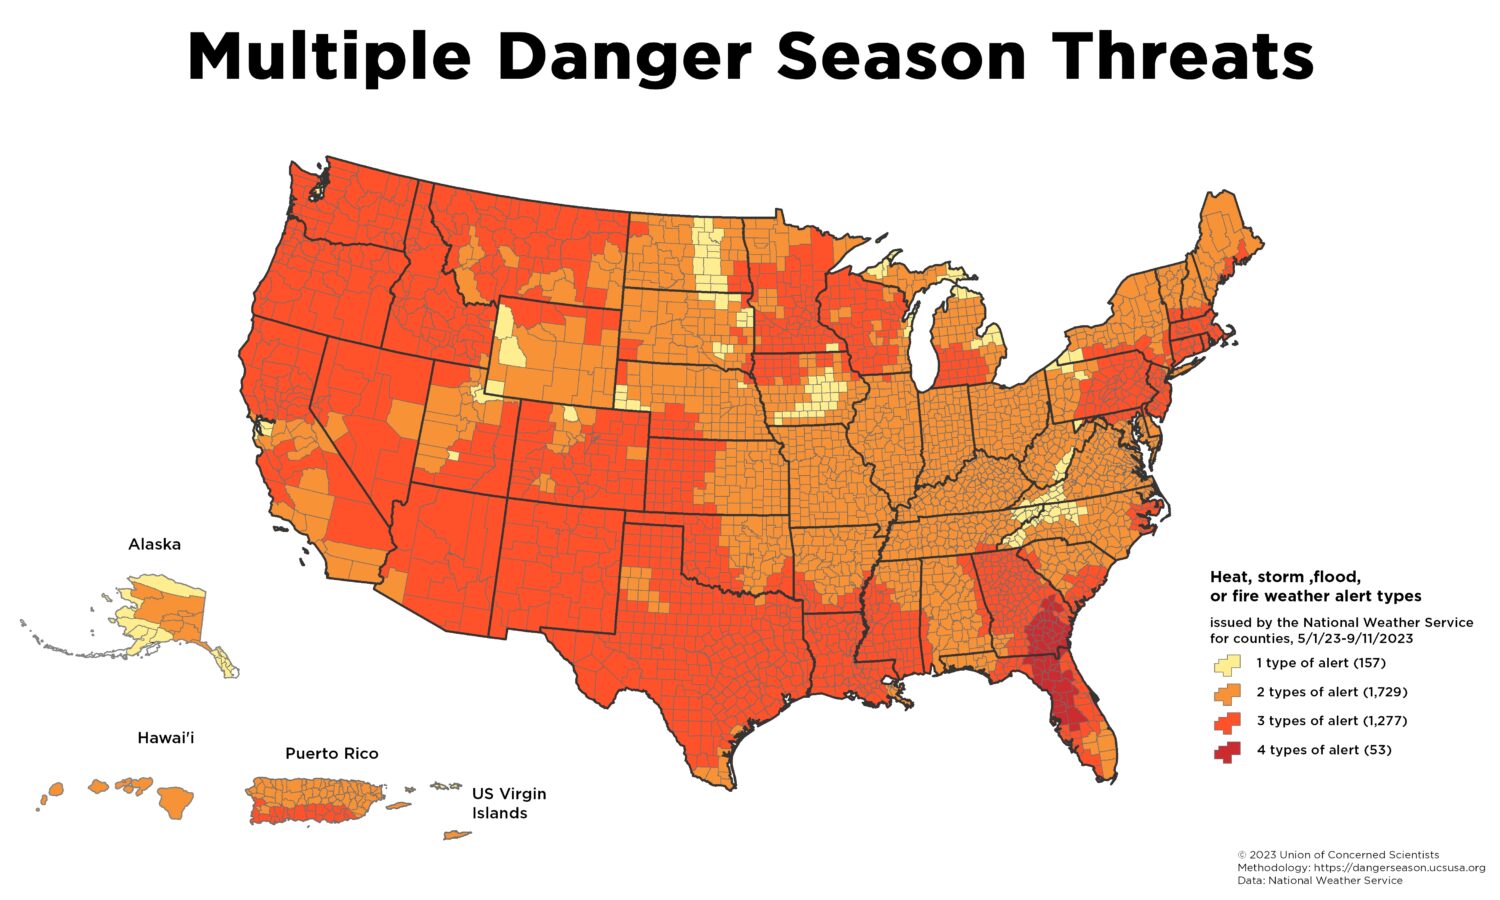
Most places in US have faced two or more types of Danger Season threats
Though I have presented heat, storm, flood, and fire weather Danger Season threats individually, these have not been experienced in isolation from one another. In fact, 95% of all counties that were under alerts saw at least two types of alerts during Danger Season. Notably, 53 counties in Florida and Georgia in the path of Hurricane Idalia faced the quadruple-whammy of at least one of each storm, flood, heat, and fire weather alert types.
Disaster aid must be adequately funded to assist with rising, staggering, and inequitable Danger Season impacts
The US has been struck with a record-breaking 23 separate weather and climate disasters—each with losses exceeding $1 billion—between January and August 2023.
Danger Season is not over yet, but the US Federal Emergency Management Agency (FEMA) Disaster Relief Fund (DRF) is nearly depleted. Hurricanes appear to have picked up late in the season and the wildfire season is not over yet, so more disasters could happen before Danger Season ends. And the legal authority to respond to extreme heat—the number one killer among extreme weather in the US—is hampered because it is not included in the Stafford Act which governs Presidential disaster declarations and federal disaster response.
Clearly, Congress needs to replenish the Disaster Relief Fund. In addition, Congress should permanently reauthorize the National Flood Insurance Program (NFIP), modernize its policies and codify a flood insurance affordability program. Danger Season impacts are coming at us faster than we can respond to them. We need policies and resources in place to avoid climate impacts that are worsening every year.