

Danger season in the United States is the time of year between roughly May and October when a number of climate-related hazards, including heatwaves, floods, wildfires, and hurricanes, tend to occur—at times simultaneously or back-to-back. Climate change is making many of these events more frequent, intense, and/or longer-lasting, and as a result, more and more communities are at risk of being harmed.
We are four months into Danger Season, and we have another two months or so to go before the season *hopefully* starts to wind down. My colleagues and I have been monitoring extreme weather on a daily basis since May. We have been keeping track of the number and location of extreme heat, flood, hurricane, and fire weather alerts that the National Weather Service (NWS) Weather Forecasting Offices across the country issue to inform the public on what to do and keep us safe. What has Danger Season brought so far this year?
Extreme Heat
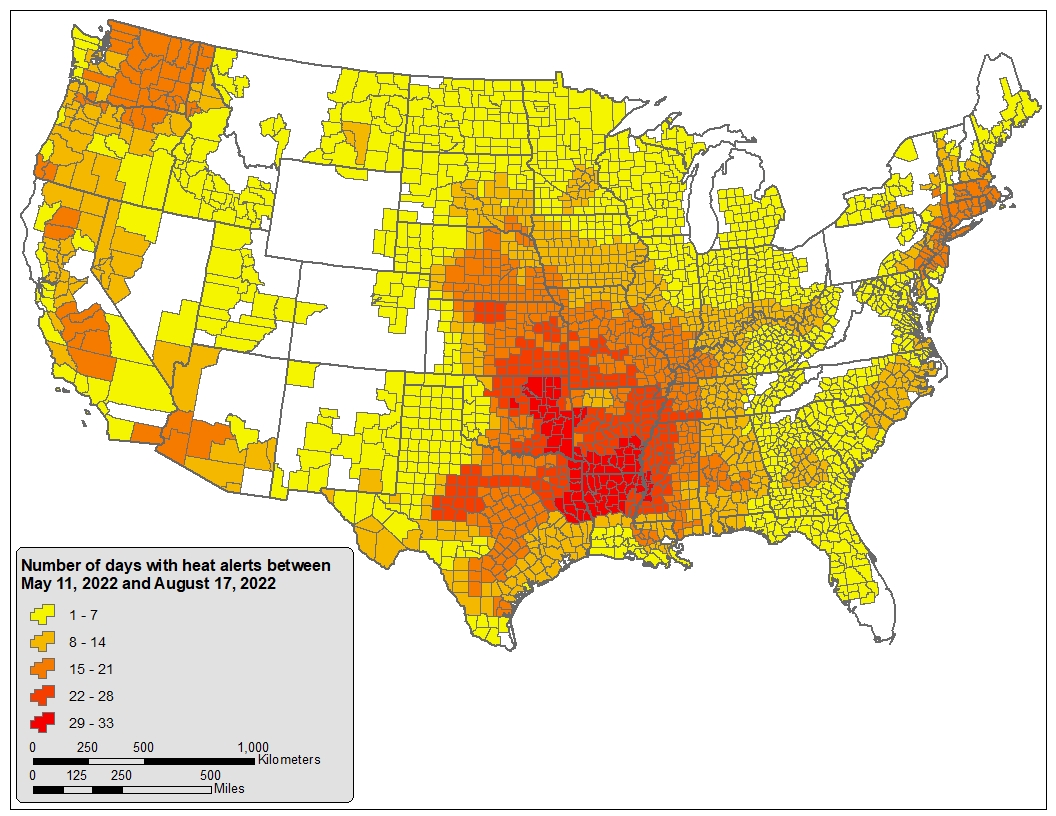
I am sure you have seen ample news coverage of—or experienced—the brutal heat that has affected the US this year. Across large urban areas, smaller rural communities, and many places in between, extreme heat episodes during Danger Season have threatened a very large slice of the population. In fact, 85 percent of US counties—nearly all counties in the lower 48 states—experienced at least one heat alert since the May 1 start of Danger Season.
And in many counties, high heat conditions occurred over many days: 1,569 counties, or about half of all counties in the contiguous United States, had alerts for at least seven days, though those days were not necessarily consecutive. In early June, for example, thousands of people in Madison (WI) endured temperatures in the upper 90s without power and air conditioning after thunderstorms knocked out power lines.
From the map below we can see that areas with the highest number of days with heat alerts are in the Southern Great Plains and the Southeast. 107 counties in five states (AR, LA, MS, OK and TX) in these regions had heat alerts for 28 days or more. Again, these were not necessarily consecutive days, but consider that in the roughly four months since Danger Season began, these counties were under high heat alerts for about one month’s worth of days!
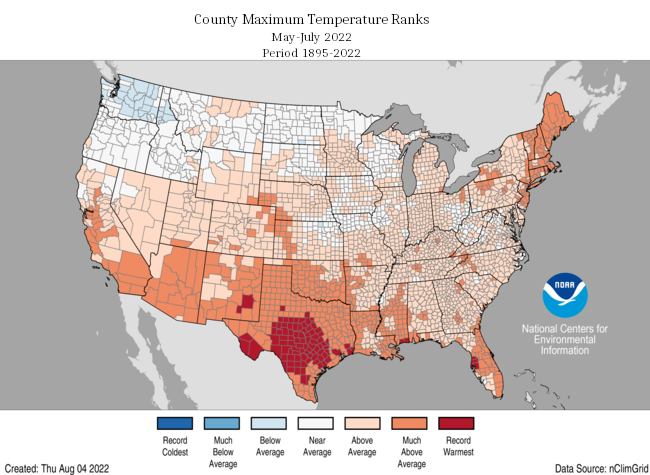
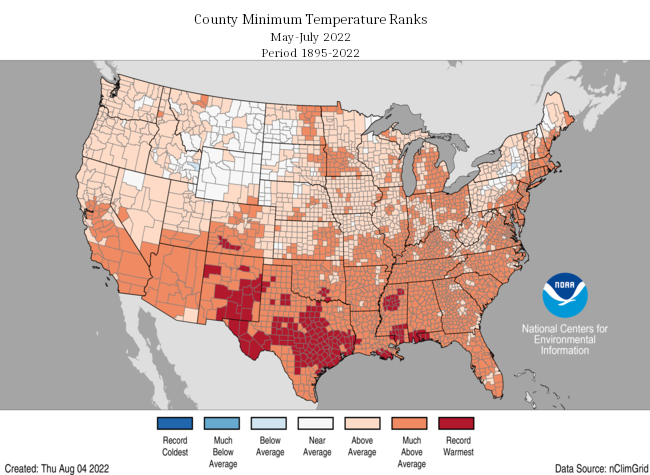
Between May and July, both maximum (daytime) and minimum (nighttime) temperatures in many of the counties across the lower 48 states have been much higher than the historical average, and in some cases, those temperatures have been the warmest since record keeping began in 1895, as you can see in NOAA’s climate summaries maps below. Given those warmer-than-average temperatures, it’s not surprising that we’re seeing so many days with heat alerts.
Floods
Since the 2022 Danger Season started in May, nearly half of all counties in the continental US (49.1 percent) have been under at least one flood alert issued by their local NWS office. 158 of all counties in the lower 48 states have experienced flood alerts for seven or more days, though not necessarily consecutively. While that’s only 5.1 percent of all counties, it’s likely an undercount of flood risk this year, because we started our monitoring in May, well after the annual springtime flooding season typically begins.
Some counties saw a very high number of days with flood alerts. For example, Woodruff County (AR), Crow Wing County (MN), Sanborn County (SD), and Catron County, Los Alamos County, Mora County, and Sandoval County (all in NM), were under alerts between 22 and 33 days—that is, between 3 and 4 weeks’ worth of flood alerts since May.

Fire weather
The combination of warm temperatures, very low humidity, and strong winds can increase wildfire risk. The National Weather Service issues “red flag” alerts when these conditions occur.
So far in this year’s Danger Season, 511 counties (or 16.5 percent) in the lower 48 states have been under at least one fire weather alert. The land area in those counties amounts to nearly 3 million square kilometers, meaning that about 40 percent of the total land area in the contiguous US was under at least one fire weather alert since the 2022 Danger Season started. 22 counties had between 15 and 23 fire weather alerts since then (or about 2-3 weeks’ worth of alerts).
In New Mexico, for example, where most counties have had between 8 and 14 days with fire weather alerts, wildfires have gotten larger since the mid-1980s. Across the Western US, temperature increases associated with human-caused climate change over the last 40 years are part of the reason the region has experienced growth in the size of wildfires. Increasingly large wildfires threaten human lives, water resources, and transportation and housing infrastructure, and also increase the risk of mudslides and flash floods.

Concurrent extreme weather events
During Danger Season, extreme heat episodes, floods, and wildfires can at times occur simultaneously or back-to-back.
While we didn’t assess how the co-occurrence of heat, floods, and fire weather alerts has changed from the historical average during this year’s Danger Season, we did look at the frequency of these three types of alerts in counties during the same week. Having to deal with at least two extreme events among flood, heat, and fire weather events within short timeframes compounds health risks for the populations and first responders affected.
In early August, for example, nine Kentucky counties were severely impacted by floods that prompted FEMA disaster declarations; the following week, those counties were under NWS heat alerts as the heat index reached the 95°F-100°F range.
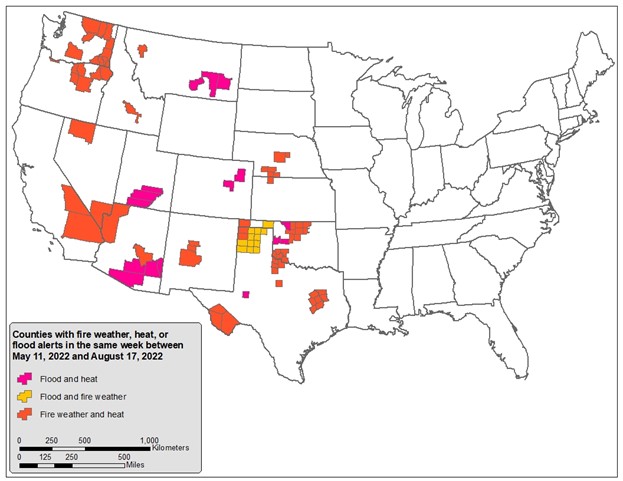
So far during Danger Season, 116 counties in the Great Plains, the Southwest, and the Northwest were under multiple types of alerts during the same week. Of those, 83 counties had concurrent fire weather and heat alerts, 18 had flood and heat alerts, and 15 had fire weather and flood alerts.
Our first Danger Season snapshot
The results in this post are a snapshot of this year’s Danger Season and we don’t have the corresponding snapshots from previous years. But we do know this: in many of the areas where there were a large number of heat alerts since Danger Season started, the number of days with high temperatures is high.
For example, in July 2022, Tulsa, OK saw 20 days with maximum temperatures above 100°F, and the next higher number of such days, 26, occurred in 2011.
In the Dallas/Fort Worth area, similarly, there were such 27 days above 100°F, and the last time there was a similar number (30) was also in 2011 (see the methods description at the end of this blog post for data sources).
While these results certainly paint a picture of a country that’s been slogging through a summer of climate-related extremes, they can’t tell us for sure whether or how this year is exceptional because of human-caused climate change.
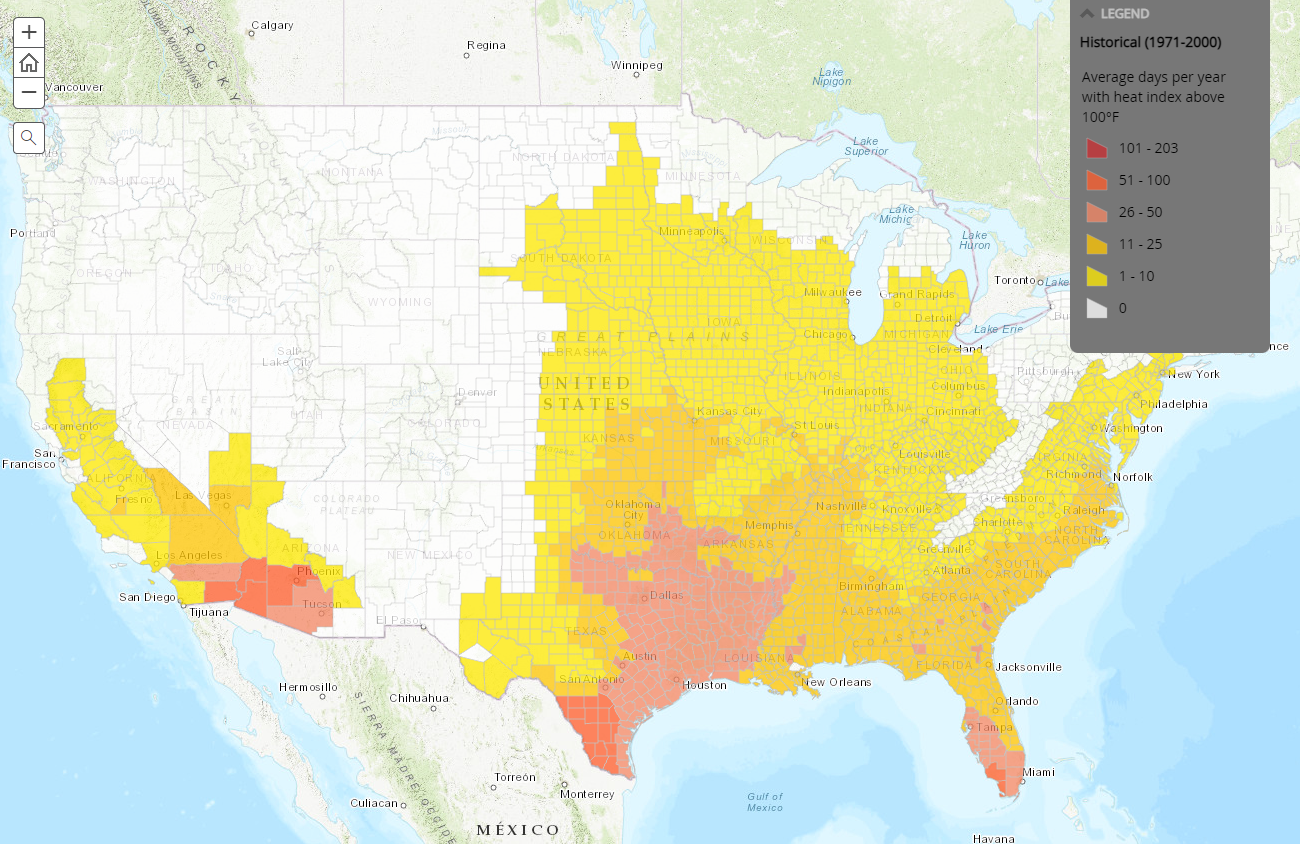
How do these results compare with the historical number of days with a heat index above 100°F in UCS’ 2019 Killer Heat analysis? The frequencies of heat alerts and days above 100°F are comparable for most regions, with the exception of the Pacific Northwest and the Northeast. By midcentury, we can expect even more frequent heat, as the projected number of days above 100°F is higher than the number of heat alerts in most places.

It’s important to note that heat and other extreme weather alerts from the NWS are an imperfect way to track risk over the course of a season or over the course of many years. The criteria for issuing alerts can change over time, making comparisons from year to year tricky. And the offices issuing these alerts also use some local discretion to determine whether and when an alert is needed.
For example, a 95°F day in early May, when the local population is not yet seasonally acclimated to high temperatures, might warrant an alert, whereas the same conditions in mid-August, when people have had a few months to adjust to the warm season, might not. Nonetheless, the frequency of alerts this year can give us a sense of how frequently conditions have crossed the threshold of being potentially harmful to human health and lives.
How to address Danger Season
We need to act to protect vulnerable people from the very real threats of Danger Season for example, by providing access to cooling and creating incentives for residential electrification powered by clean energy. Congress needs to pass both the National Climate Adaptation and Resilience Strategy (NCARS) Act so there can be a plan for managing compounding hazards, and the Asunción Valdivia Heat Illness and Fatality Prevention Act to protect outdoor workers from extreme heat. And the recently-signed Inflation Reduction Act, though containing provisions that could increase the harms that frontline communities face from fossil fuel pollution, will otherwise be a big step forward in electrification, environmental justice, and climate resilience.
Danger Season will continue to threaten our lives and wellbeing and we need to act now to avoid the worst of climate impacts.
Access data and supporting information here.