
In the coming years, Philadelphia gardeners may try out some new plants and retire old favorites after an updated government map was released this fall. The USDA Plant Hardiness Zone Map gives gardeners a sense of which plants can grow in their region and which aren’t likely to make it through the winter. In this newest update, many Philadelphia residents have moved into a warmer half zone, reflecting changing environmental realities.
Natural history collections, like those at the Academy of Natural Sciences, help us understand these changes.

What is the Plant Hardiness Zone Map?
The updated map was produced in a collaborative effort between the USDA and Oregon State University and is built to reflect the average coldest temperatures an area receives each year. This minimum temperature is an important factor for plant survival, as special adaptations are often needed to withstand cold conditions. Researchers collected the data that was used to create the map at more than 13,000 weather stations around the country over a span of 30 years. The finished map divides the U.S. into 13 zones, with each zone reflecting a 10-degree minimum temperature range.
This year’s update is the first in over a decade. Released in 2012, the previous version split Philadelphia in two. Northern Philly was in cooler Zone 7a, and southern Philly was in warmer Zone 7b. In this new map, the city is reunited once again with only the farthest corner of north-eastern Philadelphia remaining in 7a.

Understanding Our Changing Zones
Zone 7 is fairly mild; the magazine Southern Living published a 2023 article before the new map was released, giving zone 7 planting suggestions for the mid-south.
Academy volunteer and Philadelphia gardener Jennifer Quick has taken note of the changing map. “I moved into my house in ‘85,” she explained; “at that point, we were still in Zone 6a. Now, we’re on to 7b.” She’s also noticed an accompanying shift in climate. “It’s definitely hotter,” she said, “and I’d say there’s been more severe weather.”
While, due to the volatile nature of minimum temperature, specific changes to the map cannot be directly attributed to climate change, the general trend is one of warming. Average minimum temperatures rose in 95% of the sites where data was analyzed for this project.

What Does This Mean for Plants?
This trend is likely to continue in the coming decades, and, as it does, the city landscape may change. As the climate warms, some plants have become less suited to Philadelphia. At the same time, some more temperate plants have become better able to survive in the region.
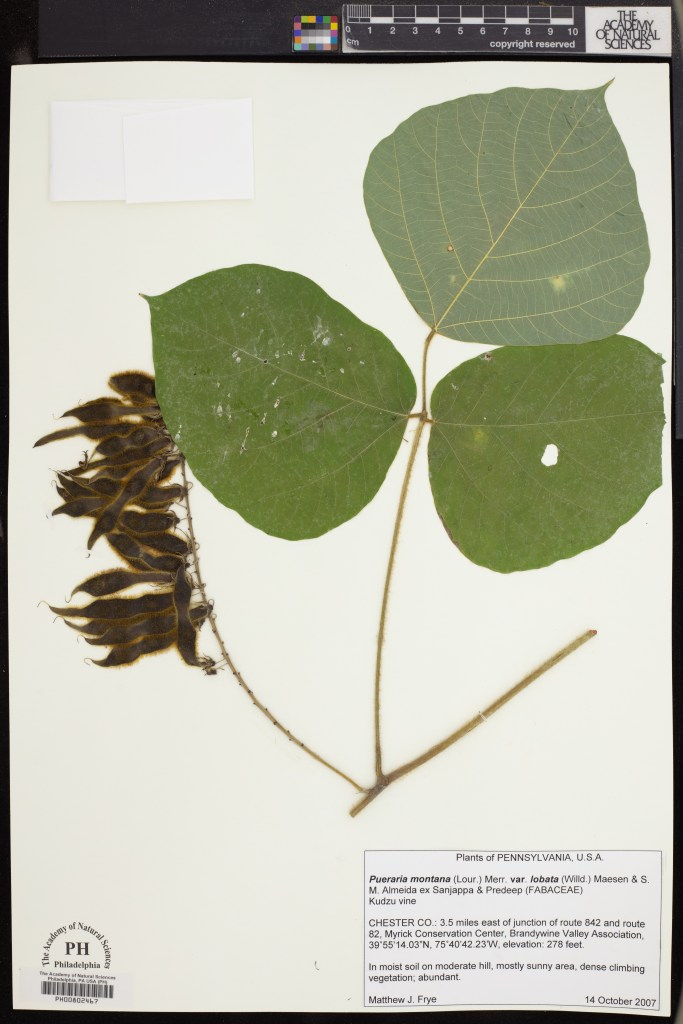
One such plant is the invasive species kudzu (Pueraria montana var. lobata). Nicknamed “the vine that ate the South,” kudzu was seemingly unable to tolerate Pennsylvania’s cold winters in the mid twentieth century. Within a few decades, though, that had changed and today the plant is established within the city. As Philadelphia continues to warm and our plant hardiness zone continues to rise, more southern invasive species may gain a foothold here.
Still, many plants show a remarkable resilience across a wide swath of environmental conditions. For example, American basswood (Tilia americana), American witchhazel (Hamamelis virginiana) and giant goldenrod (Solidago gigantea) and all have native ranges spanning up and down the east cost of the U.S. thriving in in Georgia and Maine alike. These wide tolerances and geographically varied populations can help buffer the impact of changing conditions on these species, especially if those changes happen slowly.
The Importance of Botany Collections
As researchers seek to understand how plant distributions change, they turn to resources like the herbarium at the Academy of Natural Sciences. An herbarium is a collection of pressed plant specimens. Each specimen comes with information about where and when the plant was collected. Across the world there are hundreds of millions of specimens like these; at the Academy, the Botany Department houses about 1.4 million specimens spanning more than 300 years of history. When they’re looked at together, these specimens can provide a map of where a plant grows and lend insight into invasive species introductions.
It doesn’t stop there though. Herbarium specimens both provide DNA for studying evolutionary relationships and allow us to understand the current climate where a plant grows. When we pair these two things together, we can infer the climate conditions where the ancestors of modern plants might have been found. In this way, herbarium specimens allow us to model how plants responded to historical climate shifts over millions of years, and even serve as the basis of projections for how species might respond to future climate change.

From crops, to shade, to erosion control, to garden spaces, people rely on plants. This means it’s vital to both understand how plants respond to climate change and create practical tools for navigating changing climate conditions. The new USDA map serves as one such tool, aiding gardeners and growers looking to plant strategically for long-term success.
And for plant-lover Quick, it’s a matter of planning for the future. “If my zone is at the very edge of where something grows, I probably won’t plant it.”
Written by Emily Humphreys, Eli Kirk Price Plant Science Fellow interning in the Botany Department at the Academy of Natural Sciences. Thanks to Botany Department volunteers Jennifer Quick and Naomi Miller for their assistance with this article.
The combination of clear graphics and informative text makes the post easily comprehensible. As a gardening enthusiast, I find it particularly intriguing to learn about the shifts in hardiness zones within urban settings. Thank you for your contribution, which not only educates but also prompts thoughtful consideration.