Curtis Riganti, climatologist at the National Drought Mitigation Center, speaks with Delaney Nelson, Circle of Blue reporting intern, about the latest U.S. Drought Monitor map.
Transcript
Eileen Wray-McCann: Welcome to Speaking of Water, from Circle of Blue, where we discussions of vital water topics that often flow beneath the headlines. This week we’d like to share the work of one of our summer team members, Delaney Nelson, who comes to us from Northwestern University. Delaney talks to climatologist for the National Drought Mitigation Center for some insight into a future that is, quite literally, looking drier.
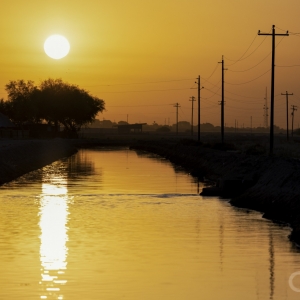
DELANEY NELSON: The American West is experiencing its most severe drought in twelve hundred years. Dry conditions are setting records nearly every week. As western states grapple with the effects of drought and a drying climate, arid land, shrinking water supplies and intense heat have become the norm.
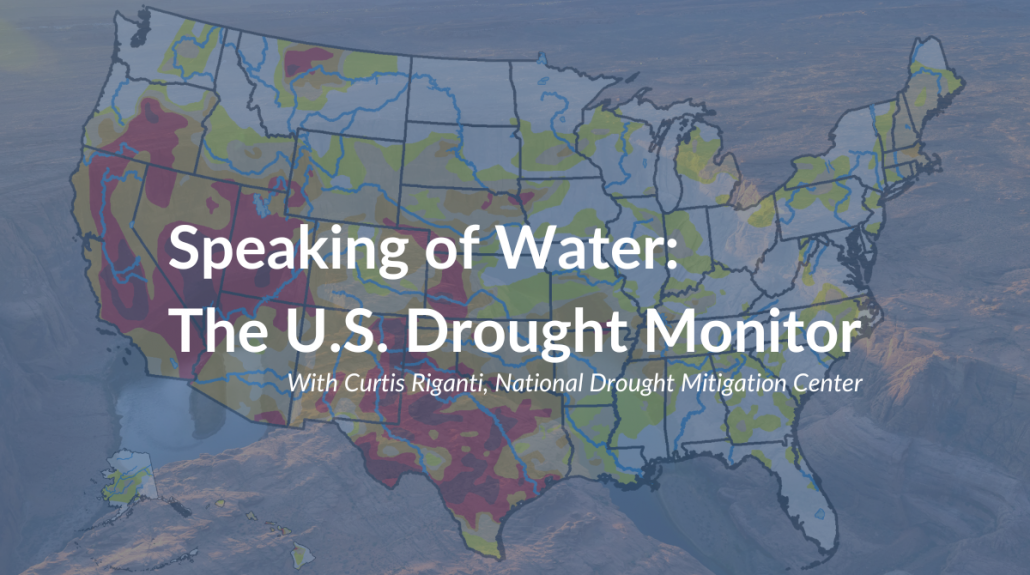
Every Thursday morning, the National Drought Mitigation Center releases a map called the US Drought Monitor, which tracks the latest data on dry conditions throughout the country. It’s a white map of the United States covered in some configuration of orange, yellow, and red – each color denoting how dry an area is.
Last week, the Drought Monitor reported that forty-two states are in some form of drought. More than seventy percent of the West is experiencing moderate drought or worse.
The researchers that create the map analyze factors like precipitation, soil moisture and streamflow to determine how severe drought is in each state and county. National Drought Mitigation Center climatologist Curtis Riganti, author of this week’s map, is here to explain how exactly the weekly drought monitor is made, and what it’s telling us.
DN: Can you introduce yourself and tell me a little bit about what you do?
CURTIS RIGANTI: My name is Curtis Riganti. I’m a climatologist at the National Drought Mitigation Center here in Lincoln, Nebraska at the University of Nebraska. So as a climatologist I, specifically here at the NDMC, focus on drought. So one of my main tasks is, maybe six to eight times per year, working on the US Drought Monitor map and then there’s a few other times that I’ll do the Pacific Islands and Virgin Islands Drought Monitor too. Then outside of that a lot of my work focuses on other various IT tasks and then some research that looks at drought trends in the United States and a few other things.
DN: In terms of creating the drought map, can you tell me a little bit about how the weekly Drought Monitor maps are created and sort of what that process looks like?
CR: Sure. So the Drought Monitor is released every Thursday. So it’s a weekly product. And so there are I think, 10 of us right now, around the country, there are three people here at the National Drought Mitigation Center, and then a few people, at the US Department of Agriculture, the Desert Research Institute in Reno, Nevada, and several NOAA employees. So each week one person is tasked with basically, they’re the authors, so they have their name on the map. The process is basically, we’re taking the previous week’s map, and we’re adjusting the lines based on new input data that we’re looking at and then collaborating with local experts, usually on a state level who are submitting information, suggestions to us, impact information to us, and we’ll iterate on graphs from Monday until Wednesday afternoon. The lines themselves represent percentiles of drought conditions, so basically, measures of how unusually dry different areas are. We’re looking at timescales that range from usually at shortest about a month out to sometimes as long as two years, and we’re looking at a lot of different datasets because we’re trying to characterize drought on different times, on different types of drought and on different timescales. So we’re looking at precipitation deficits and surpluses, but also things like streamflow, ground water, soil moisture, vegetation health, and several other datasets like that. We’re putting all of those datasets into percentiles to basically calculate how are different parts of the hydrological cycle behaving compared to how they normally do for this location at this time of year. The lines then get adjusted based on kind of a convergence of evidence of all those different things. Often those different datasets don’t paint the exact same picture, so we’re trying to tend to try to do like a best fit.
DN: How might the hydrological cycle look different in an area experiencing drought versus an area that is not experiencing drought and dry conditions?
CR: Sure. That’s a good question. So on the on a basic sense, areas that are in drought are normally going to have a deficit in precipitation over some period of time, that’s going to have an impact on people, the environment, the economy, and that can, but you you’re also looking at multiple parts of the hydrological cycle as you’re mentioned. So oftentimes, when you see precipitation deficits over longer periods of time, you start seeing problems with streamflow, with deeper groundwater such as well levels, or at shorter periods and longer periods of time of dryness, you also start to see impacts on soil moisture levels, which can have negative impacts on crops if soils dry out too quickly. Or sorry, I should say if soils dry out below optimal levels for different crops. And then finally, so we talked about like incoming precipitation that’ll over, over different periods of time replenish these different parts of the system. You’re also going to, when you have a unusually hot drives, sometimes windy weather, you also tend to, you’ll tend to lose precipitation. When you have, when you have hot and dry weather over extended periods of time, you can also quickly lose water out of different parts of your system. This is particularly true right now, with the rapid loss of soil moisture that we’ve been seeing over parts of southern Missouri, northern Arkansas, parts of Oklahoma and Texas recently, kind of what we call a flash drought where it’s actually pretty wet, even going late into the Spring this year. And then those areas, suddenly the spigot turned off. So suddenly, no or very little rain for about a month and a half to two months. And that occurred on top of mostly unusually hot weather, windy weather at times. And so you lost a lot of your top layer moisture to that. And so things very quickly dried out. And it’s been unfortunately really impactful for different types of agricultural operations in those areas. So again, there’s sinks to water in your system. And then there’s sources. the sources are basically incoming precipitation, whether in the form of rainstorms or any areas that get a lot of their water from snowmelt that’s delayed by snowpack that accumulates over the winter, and then the timing of the melt off and how much water is stored. So
DN: So what are we seeing on this week’s Drought map? And what does this latest map and data tell us about the state of drought throughout the country?
CR: Yeah, so we’re seeing pretty widespread drought right now over the United States. It’s characterized a little bit differently in different areas. So I’d say we have one, maybe two areas of flash drought right now, that’s fairly notable. probably the most notable areas over parts of Texas, particularly northeast Texas, and then into central eastern Oklahoma, southeast Kansas, southern Missouri, northern Arkansas, and even into parts of western Tennessee, northern Mississippi. Some of these areas just got a significant amount of rainfall over the weekend. Then, early this week, though, not all areas did, some parts did miss out. And so basically a combination of really dry weather over the last couple of months. And mostly very hot weather led to quick drying out and agricultural impacts. We’re also seeing some short term drought developed right now in the northeast, particularly southern New England, over eastern Massachusetts, eastern Maine, into Connecticut and Rhode Island. And then we have more long term drought occurring over much of the west right now. Some of that’s been improved, at least slightly by the unusually early and active, North American monsoon in Arizona, New Mexico, Southern Utah, Southern Colorado, where we have seen some improvements to conditions recently. But some of the worst long term drought right now is still located over the desert southwest into parts of California and Nevada and Utah. And then a few other areas of drought are also ongoing, probably worth mentioning, western Kansas has been is in both short and long term right now, drought right now. And we’re seeing some severe and exceptional drought there that extends into northeast Colorado, Southwest Nebraska. And then we have some areas of severe and extreme drought in kind of Northern Northeastern Nebraska and surrounding states too. So and there are a few others that I didn’t get to. So as you can imagine, it’s pretty widespread currently.
DN: I want to know more about drought in the West. You mentioned western states are in a long-term drought but also feeling the effects of the monsoon and its precipitation. Can you tell me a little bit about what drought is looking like in the West right now for the people that are living there and what impacts that they’re seeing?
CR: Yeah, yeah, that’s, that’s a good question. I’m not necessarily expert on exactly what impact it’s having on people. But I’ll try to give you a good answer. So one of the major impacts that we’re seeing in drought in the west right now, particularly some of the longer term drought areas is low reservoir levels. I can’t speak to specifics, but I’ve been seeing a lot of stories about I think it’s Lake Mead right now that’s out of some of its lowest levels, if not lowest than it’s ever seen. In certain areas. I think this is the case in the Wasatch Mountains in northern Utah. Right now, we are seeing wildfires too, which is somewhat typical as you get into this time of year but usually is made worse if you have drought conditions. He’s going on. Certainly some impacts to agriculture around too. We have seen, just the recent heatwave in the Pacific Northwest led to worsening conditions, soil moisture losses and whatnot. And in the southeast Oregon too. So really across the West, it depends where you are, and really how drought would affect you in terms of like what you do for work or different things, but it’s kind of a large array of impacts we’re seeing. So probably the most notable being reservoir levels, but certainly others too. We are also seeing seeing reports of increased tree mortality in parts of California too.
DN: So another question that I have is, many people throughout the country, and especially in the West, have experienced several droughts over their lifetimes. What makes this one different? What is distinct about this year’s drought? And why should people continue to care about it?
CR: Yeah, so, the drought that we’re in right now, I would say is part of, really over the last one years or so what’s recently been described as a mega drought, where we’ve seen multiple large scale and pretty severe droughts during that time period. Some of those have had similar impacts. So the current one, that’s the hotter temperatures that we’ve been seeing this, generally speaking recently tend to make drought conditions worse. And in something like the Drought Monitor, we do account for that. But in not being an expert in exactly the what the impacts are of drought after drought after drought and kind of the precipitation whiplash that’s been described when you go from extended dry periods, and then suddenly, you’re wet and then dry periods. Again, that’s my limited understanding is that that’s having these repeated episodes can be harmful to different parts of the environment. But I’m not an expert on that by any stretch. So I’m not sure the direction I took that in
DN: Can you explain how climate change has impacted or is impacting these drought conditions?
CR: Sure, yeah. Again, not an area that I’m a expert on, but generally speaking. So there are certain parts of the country that we’re expecting to see probably more dry conditions of the long term. That’s particularly true in parts of the Southwest US into the parts of the Southern Great Plains, particularly the southern High Plains, which are some areas that we’re seeing drought right now. And then just generally speaking, drought is usually made worse when you have hotter temperatures. With climate change, we’re generally expecting warmer temperatures over time, or at least, you’re more likely to see, you’re basically if you think about it, like a deck of cards, and you have certain cards for certain types of weather, we’re loading the deck right now, in terms of hotter conditions in most places. So if you put dry conditions on top of that, where you are then yeah. Yeah, so it was not,
DN: The general drought map this week and some of the big statistics look pretty similar to last week’s map. Why is it important to watch this data weekly if it doesn’t always change a ton and it’s pretty similar to the previous week?
CR: Yeah, that’s a good question the drought map, because drought, unlike some other natural disasters tends to evolve more slowly over time, when we’re making the Drought Monitor, we don’t tend to make really quick changes to it usually, at least in terms of improvements, a category per week in some extreme instances, maybe two. Whereas we almost never increase drought conditions and make them worse by more than a category per week, just because the physical conditions often don’t warrant to doing that. So that was, that’s one reason to just keep an eye on it. in terms of the I do want to highlight the flash threat that we’re seeing over the South Central into Central US right now, like Southern Missouri through eastern Oklahoma, Arkansas, we have seen quickly degrading conditions in those areas where we’re seeing, as many are three of weather in those areas, we’re seeing pretty rapid degradation, like three to four category changes in the span of about a month, month and a half, which is unusual. We have maps, where you can see week to week or month to month change changes. And so those I think can be a bit more illuminating and seeing over longer periods of time how drive has evolved this week, or how drought has evolved.
DN: The research is showing that drought conditions aren’t going away anytime soon. As we continue to watch drought evolve, are there specific data or trends that we should be looking out for in terms of what the future might look like in terms of this climate?
CR: Yeah, I’d say for for those types of things, definitely watch for documents. I don’t remember when the next one is issued. But the National Climate Assessment because those usually we’ll get into project climate change projections in different regions, and what things like drought or pluvial flooding might look like. Then I just say in general, it’s always, this is the case, really, with any natural disaster, many other things, to try to understand what your risk is from drought in your local area, what types of impacts it’s tended to have in the past. And then just be prepared for those as best you can. the best time to prepare for a drought is when you’re not actually in one. So come up with a plan in advance so that you can be more or less vulnerable to drought, when inevitably it will hit.
DN: Thanks so much for joining me Curtis.
DN: That’s Curtis Riganti, climatologist for the National Drought Mitigation Center. And this is Delaney Nelson for Speaking of Water for Circle of Blue, where water speaks. You can share this interview and find more water news and analysis at Circleofblue.org. Thanks for listening.

Delaney Nelson is an intern for Circle of Blue covering drought in the American West. She writes Circle of Blue’s weekly roundup of drought in the American West. She’s a rising senior at Northwestern University studying journalism, political science, Spanish and environmental policy. In her free time, she likes to hang out with her dogs, play soccer and swim in Lake Michigan.