Authors Erin Rowland-Schaefer and Elizabeth Bach describe their latest Data Article presenting a visual record of the long fire history of Nachusa Grasslands, a tallgrass prairie restoration site in Illinois, USA.
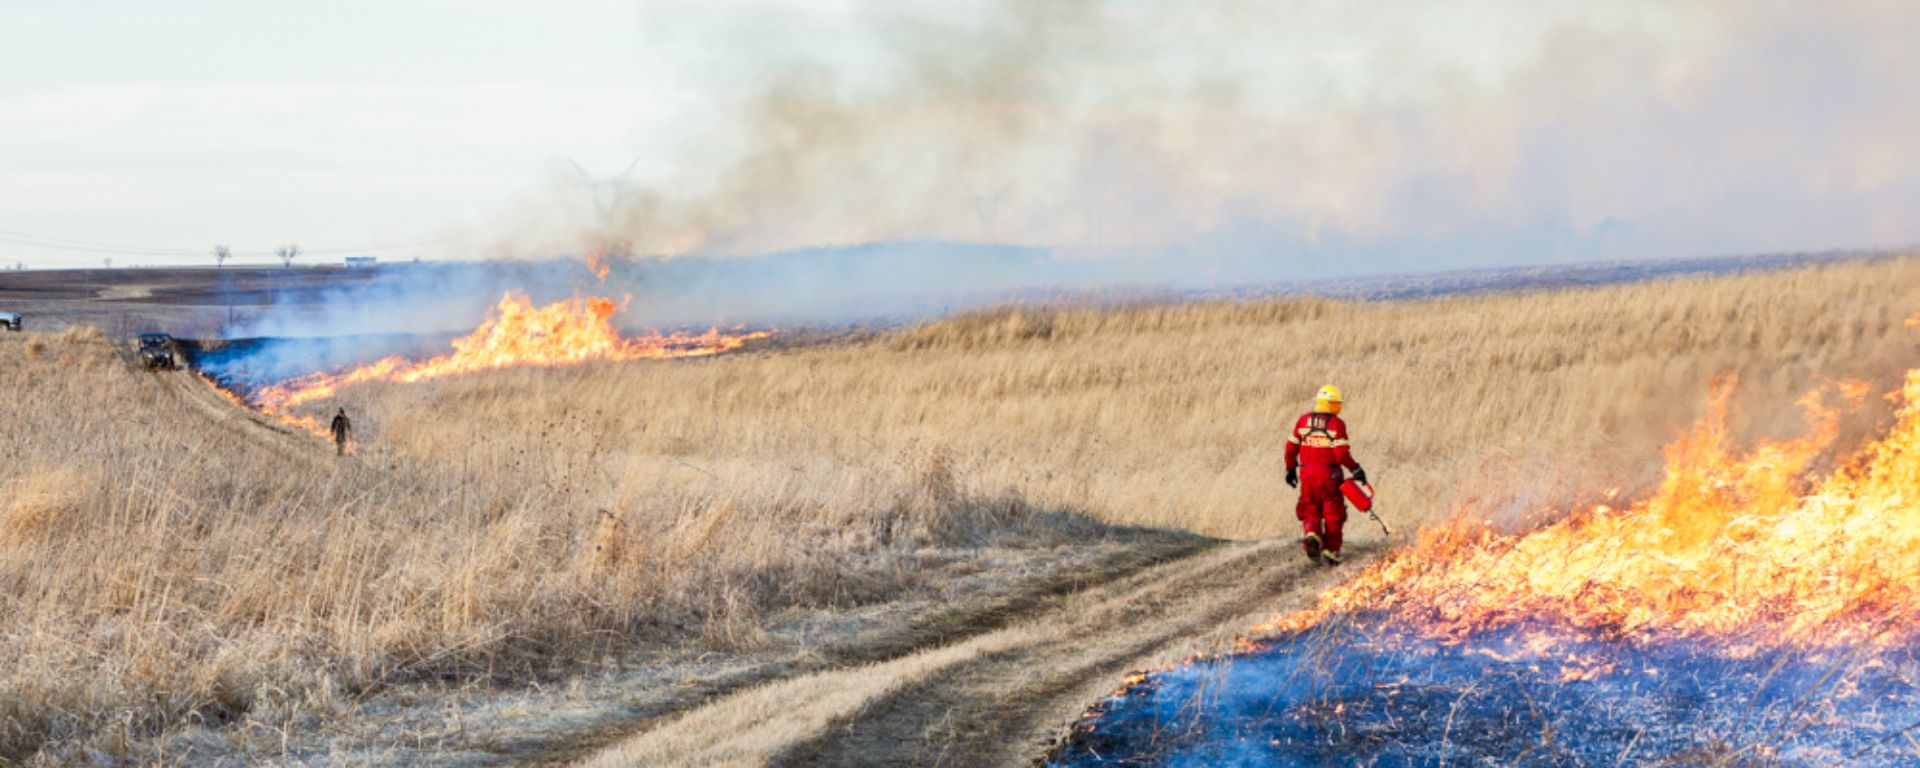
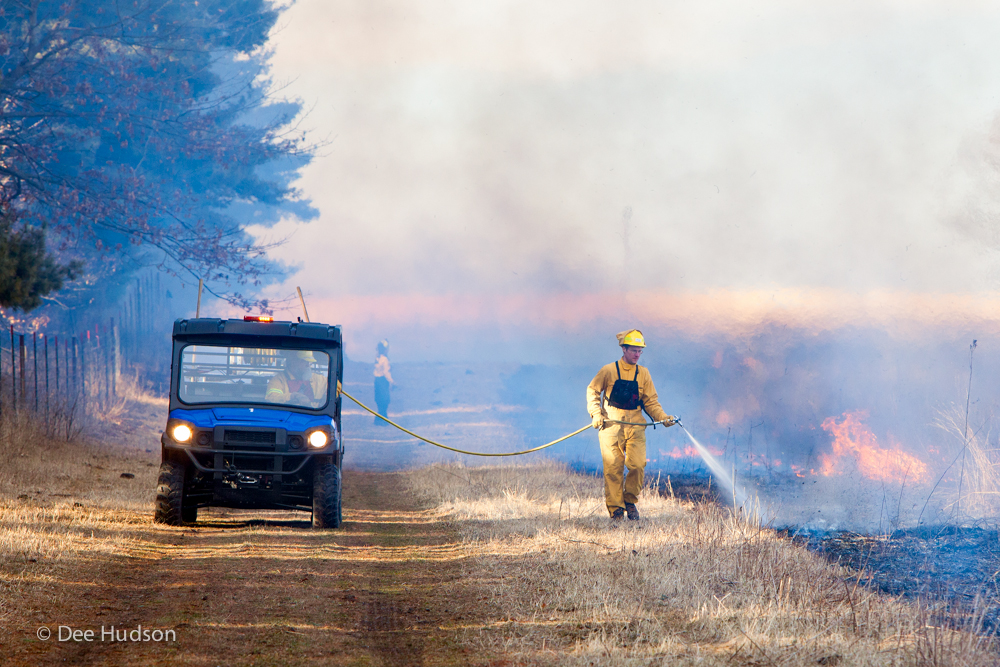
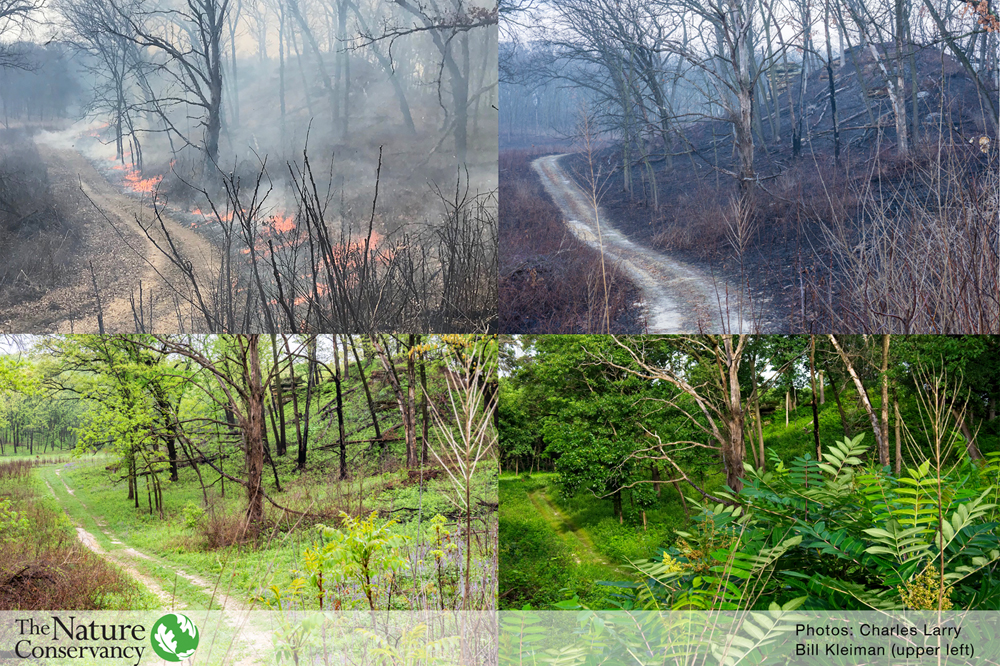
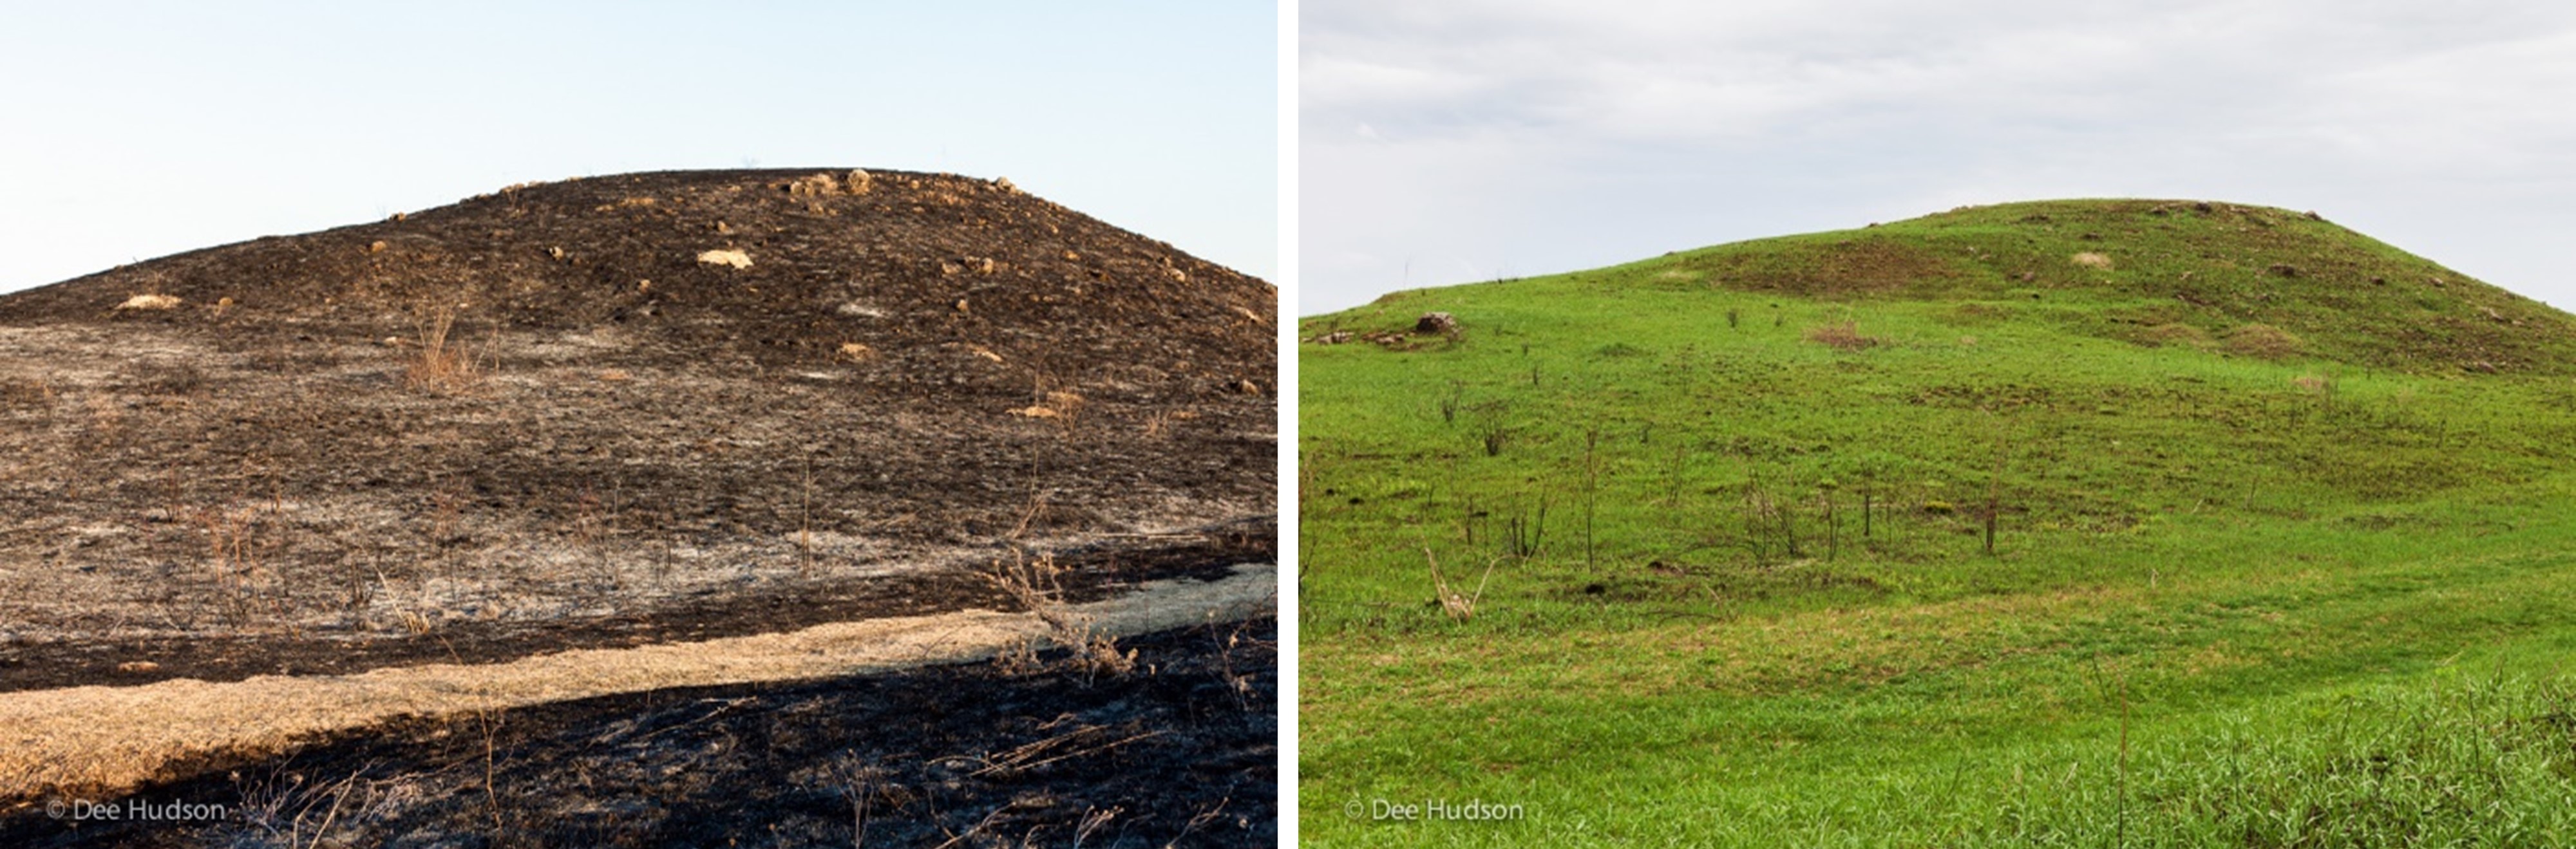
Fire has played a significant role in the development and management of tallgrass prairie ecosystems since before European colonization. While historically, fire was used by Indigenous communities to manage the movements of bison, today, Indigenous communities and other managers apply prescribed fire to support the conservation of tallgrass ecosystems that have been anthropogenically impacted. Fire helps to prevent the spread of invasive plants that are not fire-adapted, as well as to prevent the encroachment of woody vegetation.
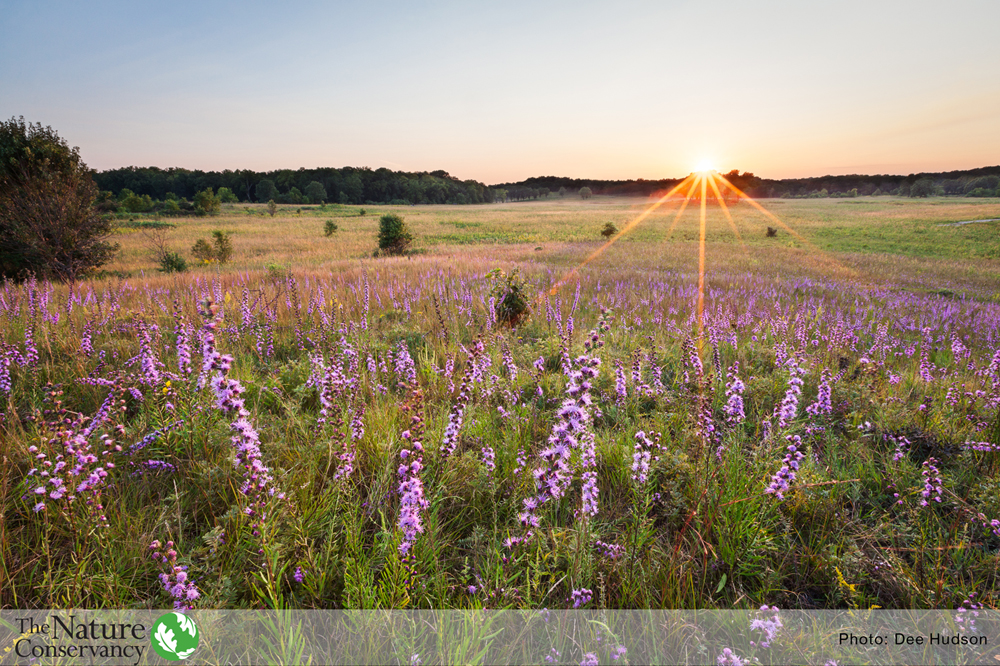
Given the importance of fire to management in modern tallgrass prairies, we set out to digitize the long-term fire management history of a restored tallgrass prairie preserve: Nachusa Grasslands. Nachusa Grasslands is a 1600 ha (400 acre) preserve owned and managed by The Nature Conservancy in northern Illinois, USA. This project sprung from a combination of circumstance and necessity.
We initially identified these maps as a project that would help support the scientists and managers working at Nachusa and across The Nature Conservancy. Many researchers are studying the impacts of prescribed fire on the preserve, so we wanted to provide an accessible, digitized record of the fire history across the landscape to support the work of others. Additionally, this was a project that was initiated during the spring of 2020, so being able to conduct work virtually became critical.
As we worked to produce these maps, we realized that these data would be beneficial to publish open access. Making fire management data open access is helpful to conservation and restoration practitioners. Land managers put a lot of work into training, planning and performing safe prescribed fires.
Understanding when fires are accomplished over years and decades provides the opportunity to connect fire regimes with ecological outcomes. Publishing these data helps other land managers see what practices are used at Nachusa Grasslands. It is also easier for scientists to access that information and perform analysis, and managers have strong interest in the outcomes of these analyses.
Mapping history
In order to produce this dataset, we began with the archival records of prescribed fire on the preserve.
For the earliest years, these were in the form of hand-drawn maps and annotations. In later years, we were able to pull from digitized maps generated for annual reports. These images were imported to ArcGIS Pro and georeferenced, meaning that we identified points on the images and matched them to the same points on the map. Thankfully, the preserve boundaries and roads were visible on all historical maps, which gave us consistent points to reference.
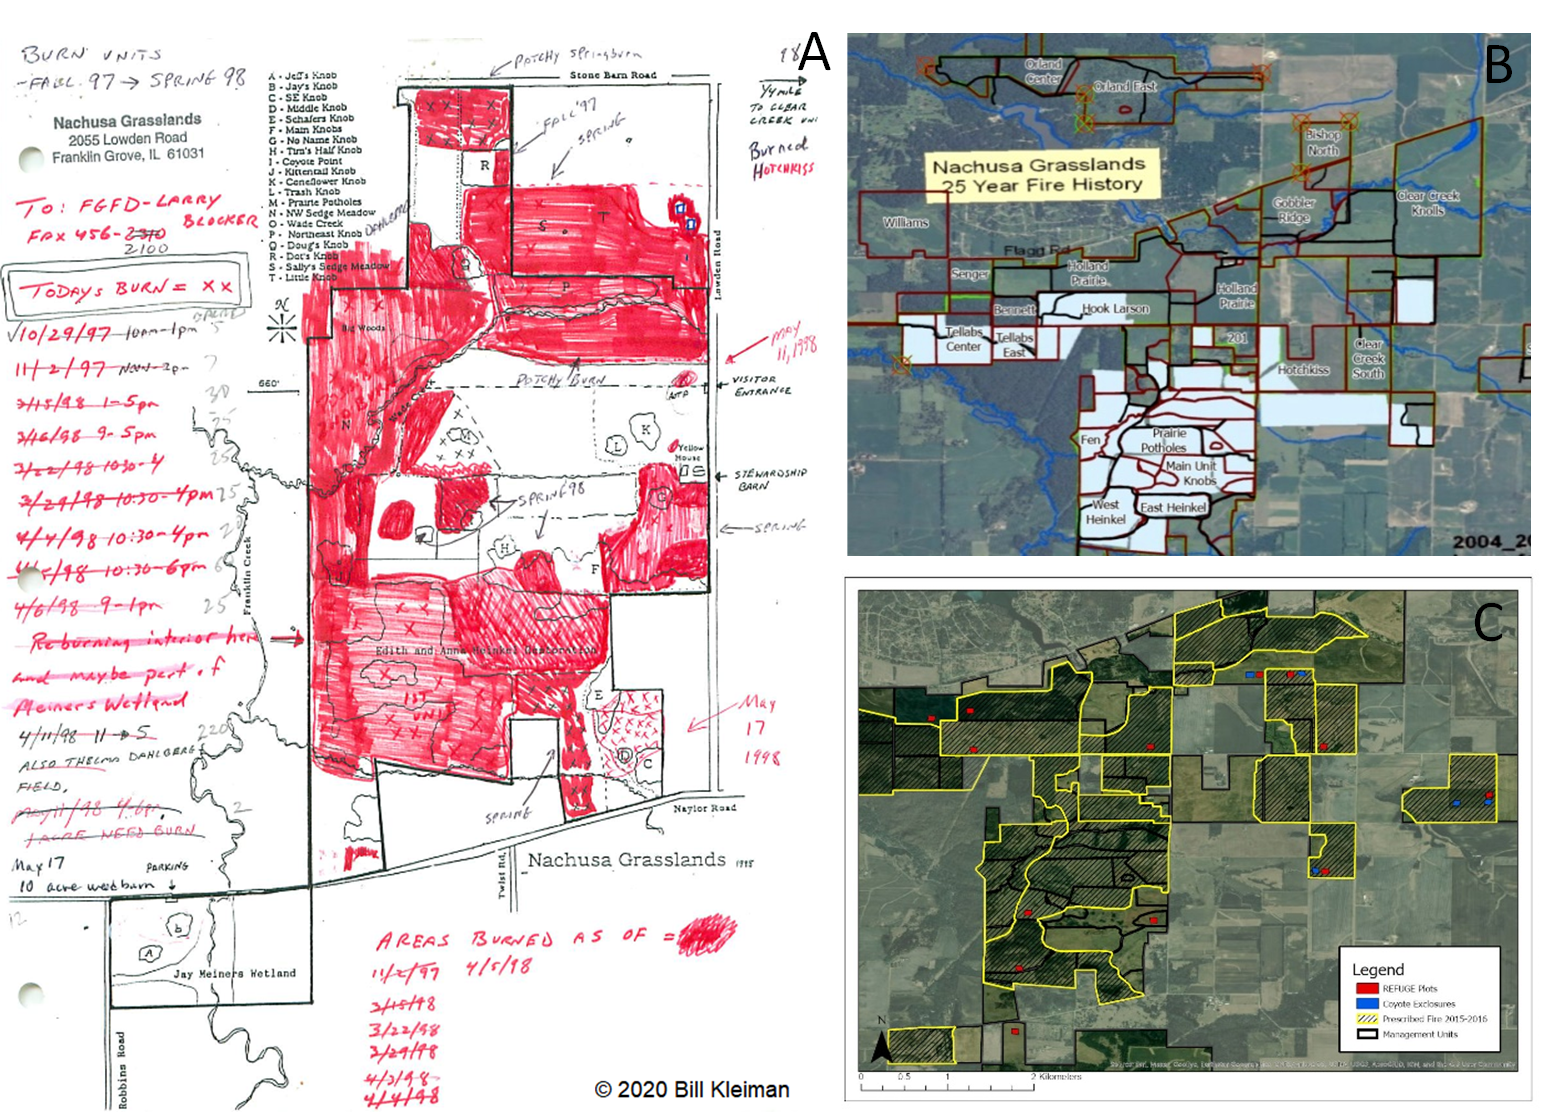
Once the image was georeferenced, it overlaid the digital map of the preserve and we were able to hand-trace the images to create a digital record of the preserve’s fire history. This resulted in a full map package containing layers for each fire season (typically running from November to April) in the preserve’s 35-year history.
Our examination of this fire history told us a little more about the patterns of fire on the preserve over time. The proportion of the preserve burned has increased dramatically over time, outpacing the growth of the preserve as a whole. This reflects increased capacity through trained volunteers and staff, equipment, and the ability to burn larger units. We are also eager to integrate this dataset into future work, both to specifically examine prescribed fire, as well as to study the impacts of prescribed fire on different taxa.
Putting maps into practice
One ongoing project will involve creating a time series map of the purchase history of the preserve, documenting purchases of remnant tracts and restoration dates of restored. Once this time series is generated, we will be able to determine fire frequency across the preserve, identifying how often an area has been burned across its history.
We are eager to apply this knowledge to assess the impacts of fire frequency, especially in comparison to the commonly used metric of fire return interval. This is a helpful metric to ensure areas with fire sensitive species, like some insects, are not burned too frequently.
We hope that by making this fire history data public (along with long-term plant monitoring data already published in Ecological Solutions and Evidence), it will encourage scientists to be similarly open in sharing analyses that can inform management decisions. For example, how has the fire frequency at Nachusa shaped plant, insect, bird, and animal communities? How does this compare with fire regimes at other sites? Are outcomes similar across broad geographic ranges, or more locally influenced?
We are incredibly excited to see what new avenues are opened as we enter an age of more open access data, and we are keen for collaboration that helps us both manage and research more effectively.
Read the full Data Article: “Mapping fire history and quantifying burned area through 35 years of prescribed fire history at an Illinois tallgrass prairie restoration site using GIS” in Issue 3:2 of Ecological Solutions and Evidence.

I love this your webstie
LikeLiked by 1 person