

California Climate Policy: A Preliminary Report Card
It’s a bit complicated, but California definitely has made substantial progress.
We all know that California’s climate policies have led the nation. But how well have these policies actually worked? That’s not as easy to answer as you might think. You have to do some digging to come up with the numbers, and their meaning isn’t always completely clear. If you compare California with the country as a whole, however, it does seem clear that our climate policies have had a real impact on emissions.
What’s the Overall Verdict?
California has done well in terms of total emission reductions – about a 10% reduction from 2009 to 2019. That reduction amounts to roughly 45 million tons of CO2, equivalent to taking ten million cars off the road. California did this despite substantial growth over the decade from 2010 to 2020, adding about 2.4 million people and expanding real GDP by well over a third.
For comparison purposes: That’s twice as big a reduction as the U.S. as a whole (really a bit more than that because some of the U.S. reduction is attributable to California). Some of the U.S. decrease was due to other states enacting their own climate policy, so the U.S. figure is not necessarily the right benchmark for where California would be if it and other states hadn’t tackled climate change.
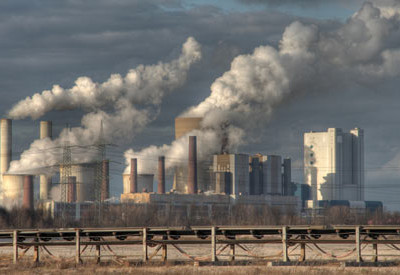
California Has Done Especially Well at Reducing Power Sector emissions.
The verdict on this issue seems very clear. Electric power related emissions went down about 40% from 2009 to 2019. The U.S. as a whole saw a roughly 30% decrease (and again, we really ought to deduct California’s contribution to be completely accurate). Over the course of the decade, then, about a quarter of California’s reduction was over and beyond the national trend. That adds up to something in the ballpark of fifty million tons of CO2 that California kept out of the atmosphere during that decade beyond what happened in the power sector nationally.
The Picture for Transportation is Less Clear.
Increases in vehicle miles traveled must have canceled out any improvement in fuel efficiency. Total direct transportation emissions in 2019 were about the same as those a decade earlier. Total gasoline sales went down a bit but diesel sales rose, which seems to have been a wash.
However, direct emissions statistics don’t reflect a fuel’s carbon intensity, that is, what happened before a fuel is actually used. Carbon intensity takes into account emissions occurring production and transportation of fuel or the fact that plants grown for biofuels actually suck CO2 out of the atmosphere. California reports about a 9% reduction in carbon intensity. Thus, California’s Low Carbon Fuel Standard made a real difference in the overall carbon footprint of the state’s transportation system.
Even if California only tread water in terms of transportation emissions, that was still better than the U.S. as a whole. The U.S. saw a 5% increase in transportation emissions over the same time period (a smidgeon larger if you factor out California).
Some Puzzles Remain.
My quick research revealed some key questions. The answers may be out there somewhere on government websites, but if so I didn’t find them:
- Why didn’t total emissions from California’s in-state generation decrease? Was there a lack of buildout of renewables? Or was renewable buildout balanced by loss of existing zero- carbon generation (hydroelectric, nuclear)?
- Did the generation share of renewables in power-exporting states increase proportionately to the added California purchases? Did the figures reported for out-of-state power represent new renewable sources or rearrangement of power contracts between existing sources?
- What impact did the Low Carbon Fuel Standard (LCFS) have on the carbon intensity of liquid fuels? As I said above, it wasn’t clear whether CARB’s carbon intensity figure conveyed this information or averaged in zero-emission vehicles or perhaps use of banked credits).
Don’t Forget: Proof of Causation is Tricky.
Sorry, as an academic I can’t help but include some qualifications. There’s no reason to keep reading unless this sort of thing interests you.
To begin with, I haven’t tried to control for other things in California that may have increased or decreased emission levels, such as population trends or changes in the types of industry. Nor did I control for differences in between California and the rest of the country. A lot of the national emission reductions were due to replacing coal with natural gas. That might have been less of a factor in California.
Another complicating factor is that California’s policies may have increased emissions elsewhere (“climate leakage”), for instance if they resulted in polluting firms moving out of the state.
Yet another complication is that California policy could also have reduced emissions elsewhere in ways not captured by the numbers: by providing policy templates for other states or the federal government (or even other countries), or by leading to technological innovations.
A more sophisticated analysis could try to take more of these factors into account, although that’s probably practical only to a limited extent. A recent CLEE report discusses similar factors in analyzing the impact of California’s zero-emission vehicle program. These complications illustrate why cause-and-effect can be hard to prove in the social sciences, and specifically why retrospective assessment of environmental policies can be difficult.
Note on data. I used a December 2022 report from the California Air Resources Board as my primary resource. Post-2021 figures don’t seem to be available (or at least I didn’t find them), and 2020-2021 numbers were distorted by the COVID pandemic and recovery. For that reason, I’ve used 2009-2019 as my comparison period. I think the state could do a better job of reporting the information more clearly and transparently. I felt that I needed to dig around more than should really have been necessary and that some of the information should have been more fully explained.
Reader Comments
2 Replies to “California Climate Policy: A Preliminary Report Card”
Comments are closed.

About Dan
Dan Farber has written and taught on environmental and constitutional law as well as about contracts, jurisprudence and legislation. Currently at Berkeley Law, he has al…
READ more
Do any of the scientific papers tell you when the atmospheric CO2 curve is going to reverse enough to limit global warming to 1.5C?
Will it be in time to perpetuate an acceptable quality of life that will save the human race?
So, “UN chief warns ‘gates of hell’ are at hand in climate summit, but carbon polluting nations remain silent” really is the best statement we can make to say we have most likely run out of time already because the curve isn’t bending like we need it to.
Keeling warned us, when we had more than enough time but we just kept focusing on the Power of Money.