Guest Post by Kimberley Corwin, Ph.D. Candidate in the Department of Atmospheric Science and Trainee in the CSU InTERFEWS Program
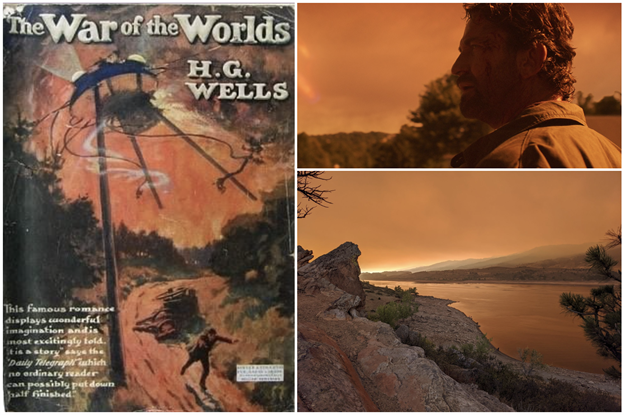
My mind turns to images from sci-fi movies and artwork, not real life, when I think about the sky glowing orange. Such depictions range from the cover art for H.G. Wells’ classic The War of the Worlds, first published in 1897, to the scenes of comet debris raining down in the 2020 disaster film Greenland. However, the fires and smoke producing those apocalyptic hues can no longer be relegated to the realm of fiction.
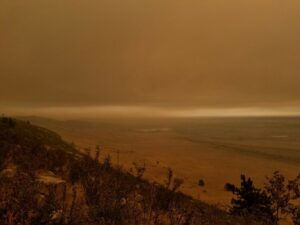
Even with their clichéd overuse of the yellow filter, disaster movies helped spark my interest in Earth science, but the first time I saw an orange sky in real life, it wasn’t from meteorites crashing to Earth or the Yellowstone supervolcano erupting. It was the Coal Seam Fire that erupted outside Glenwood Springs, Colorado in 2002, when I was in middle school. I still remember how eerie the sky looked. I also remember the most beautiful sunsets. Almost 20 years later, the 2020 and 2021 wildfires seasons saw those orange skies spread across the West and gave me new insight into how climate change will make that glow an increasingly present reality for more people around the world.
When you live near active wildfires, like those of us in Colorado, California, Oregon, and Washington, the ash and smoke can be easy to see. Large ash particles that rain down and blanket nearby communities are only a fraction of what wildfires billow into the atmosphere. Most smoke particles are tiny—much too small to see with the naked eye—and travel far downwind of active blazes. In fact, wildfire smoke covers much of the country throughout the summer, altering the path of incoming sunlight, even on seemingly beautiful blue-sky days. So, when summer rolls around, even though I can’t see the smoke overhead, I know it’s there.
Smoke-driven changes in radiation have real world consequences beyond making for good film fodder and beautiful sunsets. For one, plants rely on solar radiation to grow, and the U.S. relies on robust agricultural crop production to supply our food system. One of the most productive agricultural regions, the U.S. Midwest, had smoke overhead for 30-60% of August days in the past 15 years.1 These smoke plumes were thin but affected sunlight during the mid- to late growing season. In the West, where dryland irrigated agriculture faces other climate-driven challenges, smoke plumes are thicker blocking out far more sunlight but on fewer days than in the Midwest. Since so many major U.S. agricultural regions lie in the path of wildfire smoke, we need to understand how radiation changes impact different types of crops.
Plant and Light Characteristics Matter
Plants use light in the visible range at wavelengths of 400-700 nm, known as photosynthetically active radiation (PAR), to perform photosynthesis. Different characteristics of the plants and light influence how efficiently crops use the available solar radiation. Canopy structure, leaf area, and leaf angle dictate how many leaves are exposed to direct sunlight or hidden beneath shade. Plants can also become light saturated, meaning their photosynthesis rate no longer increases with the addition of more light. This saturation point happens at different light levels based on the plant type, thereby affecting crop yields for specific species differently.
The amount and characteristics of light at the surface changes as aerosols—small particles like those found in smoke—absorb and scatter solar radiation in the atmosphere. By absorbing part of the light and scattering some back to space, aerosols reduce the total amount of radiation available for plants. Less light can result in less photosynthesis and harm plant growth.
At the same time, forward scattering takes light off a direct path to the surface, resulting in an increase in the fraction of light that is diffuse (i.e., coming from all directions). Light moving directly toward the top of plant canopies bounces off aerosol particles and is redirected along paths that reach shaded leaves lower in the canopy. Since the light is now distributed across more leaves, plants can use the available light more efficiently.2 This increase in efficiency offsets the negative impacts plants feel from the overall loss of light and increases yield, but only to a point.
Eventually, we reach a tipping point beyond which there is simply not enough light available for plants to grow and crop yields will suffer.
Understanding Wildfire Smoke Impacts Over 15 Years
As wildfires become more frequent and burn larger areas, 3,4,5 wildfire smoke is becoming the dominant source of PM2.5 in the atmosphere over the western U.S. during the summer,6,7,8 especially in the mid- to late growing season (August). Even though we know that aerosols affect light, we want to understand the impact of wildfire smoke specifically. Two datasets can help us accomplish this goal.
Since 1994, the USDA has monitored solar radiation at sites across the U.S., primarily in agricultural and rural areas. The UV-B Monitoring and Research Program (UVMRP) started as an operational tool for the agency and agricultural users but is starting to be recognized as a valuable tool for research. Measuring total and diffuse radiation in the ultraviolet and visible range every three minutes, the UVMRP offers millions of observations for analysis. We look at data from 10 UVMRP sites that range from California to New York and North Dakota to Mississippi. These ground-based radiation measurements won’t tell us if there is smoke overhead though. For that, we need satellites.
The Hazard Mapping System (HMS) created by NOAA’s National Environmental Satellite, Data, and Information Service (NESDIS) provides us the smoke information we need. The HMS pulls together data from multiple geostationary and polar orbiting satellites to identify fire and smoke plume locations. For smoke, analysts examine true-color images every day to trace out the borders of smoke plumes. We use the HMS to determine which days are smoke free and which are smoke impacted for all 10 of our sites. We focus on the 15-year period from 2006-2020, which has good quality data for both datasets, to investigate questions including:
- How does wildfire smoke change total PAR and the diffuse fraction at the surface?
- How do clouds and smoke plume thickness affected total PAR and the diffuse fraction?
- How have regional, seasonal, and yearly variations in smoke abundance affected total PAR and the diffuse fraction over the last 15 years?
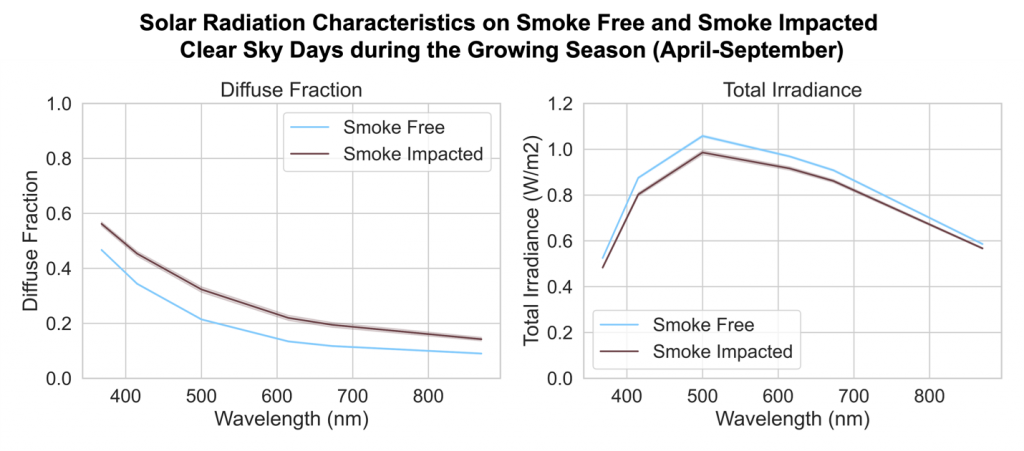
To answer our first question, we looked at smoke presence and the average diffuse fraction and total irradiance at six wavelengths. Early results confirm that smoke is changing the light at the surface (figure 2). For all wavelengths, diffuse fraction is higher and total irradiance is lower on smoke impacted clear sky days in the growing season. By looking at clear sky (i.e., cloud free) days, we better isolate the impact of smoke since clouds also affect solar radiation. Since these changes happen throughout the main U.S. agricultural growing season (April-September), our next step will be finding out what happens to crops given to these changes.
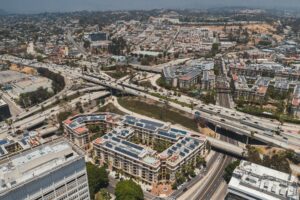
Wildfire smoke is already changing the light at the surface. Images of the Golden Gate bridge framed by a sky of the same color make these changes apparent, but the days when smoke is overhead and not so easily seen occur far more frequently. So, the question remains, is wildfire smoke improving plant productivity via gains in efficiency by increasing the diffuse fraction? Or is wildfire smoke harming plant growth by reducing the total amount of radiation available for photosynthesis beyond the tipping point? By comparing changes in diffuse fraction and total radiation across the US to crop productivity data, we will answer these questions.
Climate change is causing wildfires to occur more often and burn larger areas. 3,4,5 The western U.S. is already seeing explosive fires seasons, like 2018, 2020, and 2021, become the new norm. The U.S. food system is simultaneously experiencing stress from other climate extremes, with worsening droughts straining water availability in the irrigated west. We must account for how wildfire smoke affects plant productivity if we want to understand the full impact of climate change on our food system. By determining how crops will respond to radiation changes given their physiological differences, farmers will be able to make informed decisions about which crops will fare better under the orange sky.
1 Personal analysis of the NOAA/NESDIS Hazard Mapping System smoke product data.
2 Kanniah, K. D., Beringer, J., North, P., & Hutley, L. (2012). Control of atmospheric particles on diffuse radiation and terrestrial plant productivity: A review. Progress in Physical Geography, 36(2), 209–237. https://doi.org/10.1177/0309133311434244
3 Westerling, A. L., Hidalgo, H. G., Cayan, D. R., & Swetnam, T. W. (2006). Warming and Earlier Spring Increase Western U.S. Forest Wildfire Activity. Science, 313(5789), 940–943. https://doi.org/10.1126/SCIENCE.1128834
4 Westerling, A. L. (2016). Increasing western US forest wildfire activity: sensitivity to changes in the timing of spring. Philosophical Transactions of the Royal Society B, 371(20150178). https://doi.org/10.1098/rstb.2015.0178
5 Abatzoglou, J. T., & Williams, A. P. (2016). Impact of anthropogenic climate change on wildfire across western US forests. Proc. Natl Acad. Sci., 113(42), 11770–11775. https://doi.org/10.1073/pnas.1607171113
6 Val Martin, M., Heald, C. L., Lamarque, J. F., Tilmes, S., Emmons, L. K., & Schichtel, B. A. (2015). How emissions, climate, and land use change will impact mid-century air quality over the United States: A focus on effects at national parks. Atmospheric Chemistry and Physics, 15(5), 2805–2823. https://doi.org/10.5194/ACP-15-2805-2015
7 Ford, B., Martin, M. V., Zelasky, S. E., Fischer, E. V, Anenberg, S. C., Heald, C. L., & Pierce, J. R. (2018). Future Fire Impacts on Smoke Concentrations, Visibility, and Health in the Contiguous United States. GeoHealth, 2, 229–247. https://doi.org/10.1029/2018GH000144
8 Mcclure, C. D., & Jaffe, D. A. (2018). US particulate matter air quality improves except in wildfire-prone areas. Proceedings of the National Academy of Sciences of the United States of America, 115(31), 7901–7906. https://doi.org/10.1073/pnas.1804353115